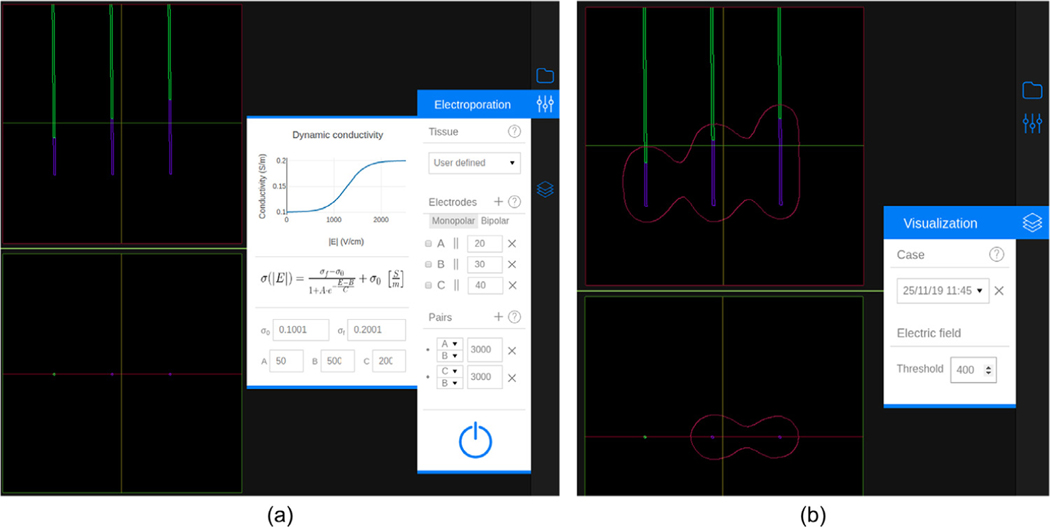
Fig. 3.
An electrode configuration with three electrodes and two pairs. (a) Inserted electrodes and the “Electroporation” menu. The menu contains three sections: Tissue, Electrodes and Pairs. The dynamic (non-linear) conductivity plot is displayed when the selected tissue is “User defined”. The “Electrodes” section shows a list of all the defined electrodes. Each element has, from left to right, the distance combobox (to measure separation between electrodes), the electrode label, the parallel button, the exposed length, and the delete button. The “Pairs” section shows a list of the specified pairs, showing the labels of the two electrodes selected and their voltage. At the bottom of the menu there is a button to execute the simulation. (b) Visualization of the electric field distribution at 400 V/cm and the “Visualization” menu. In this menu a simulation (case) can be selected and the electric field threshold can be specified.

