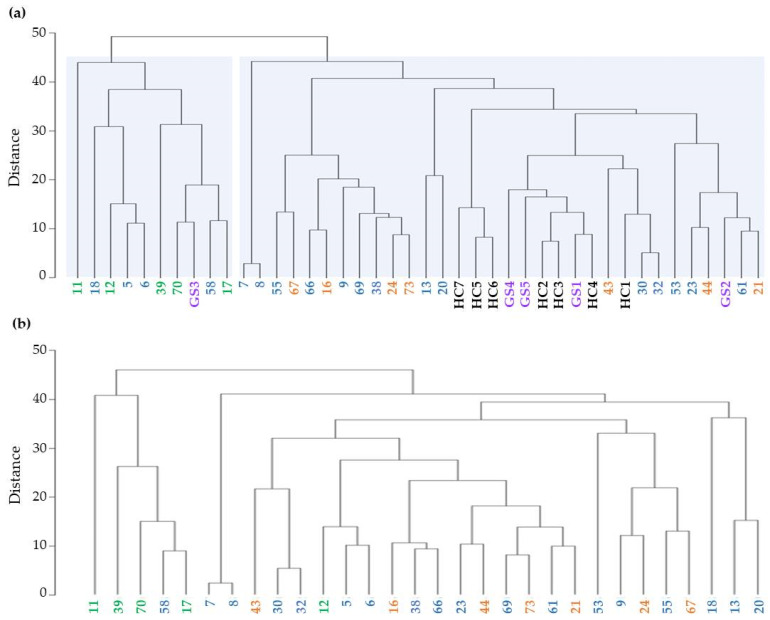
Figure 3.
Clustering analysis of UEv protein profiles. (a) Clustering analysis of INS patients, healthy control (HC) and Gitelman syndrome patients (GS): SSNS (n = 7, orange), SDNS (n = 18, blue), SRNS (n = 5, green), GS (n = 5, purple) and HC (n = 7, black). (b) Clustering analysis performed within the INS patients: SSNS (n = 7, orange), SDNS (n = 18, blue) and SRNS (n = 5, green).

