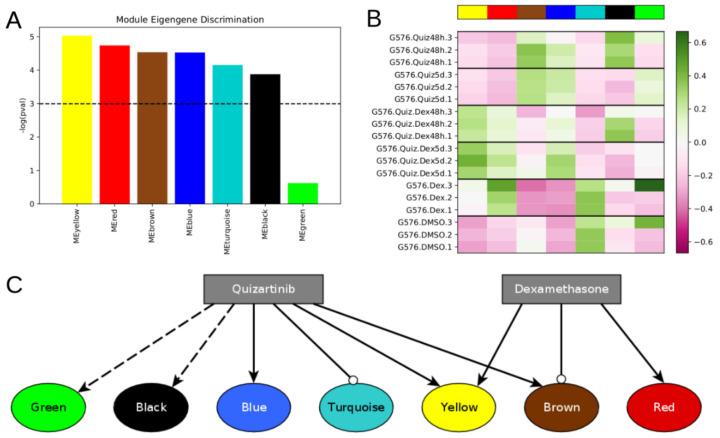
Figure 1.
Differentially expressed modules respond differently to different treatment conditions. (A) WGCNA identified seven gene co-expression modules from the DMSO and drug treated FLT3-ITD AML expression dataset, six of which are differentially expressed across the six different treatment conditions. (B) Heatmap showing module eigengene expression for each module in each sample. High module eigengene expression reflects high average expression of genes within that module. (C) Qualitative model showing the effect of each drug on the expression of genes within each module. Arrow-tipped edges indicate activation, while circle-tipped edges indicate repression. The dotted edge from quizartinib to the black module reflects the observation that black module genes are upregulated at 48 h by quizartinib, but become downregulated again by five days of treatment. The dotted edge from quizartinib to the green module reflects that the green module is not upregulated after 48 h, but is after 5 days.

