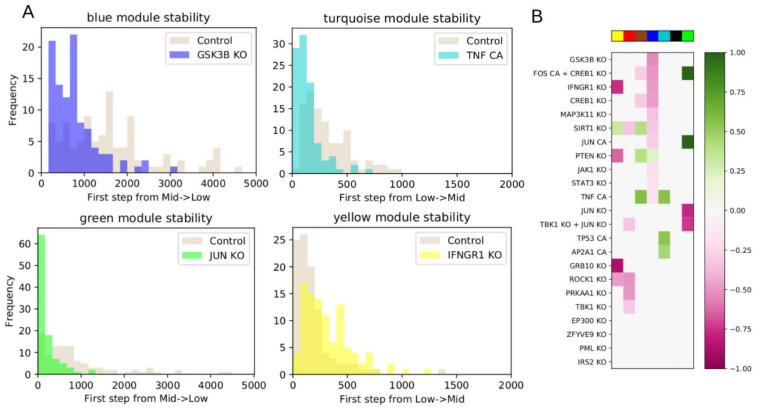
Figure 5.
Targeted interventions of driver nodes cause up- or down-regulation of gene modules. (A) Distribution of the number of steps required for the module to switch between low and intermediate activation. The distributions in beige show the dynamics of the system with no manipulations, while the colored distributions show the manipulated systems. For modules transitioning from low to intermediate activation, an intervention shifting the distribution to a longer time to switch (rightward shift) maintains the module in the downregulated state, while a leftward shift upregulates the module. For modules transitioning from intermediate to low, a rightward shift indicates the module is maintained in an upregulated state, while a leftward shift indicates downregulation. (B) Heatmap showing the up- or down-regulation of statistically significant interventions (two-sided Mann–Whitney U Test, FDR-adjusted p-value < 0.05) compared to control for each module. Only significant interventions are colored. Colors are scaled so that a value of +/−1 indicates a 100% relative shift in mean transition time compared to control.

