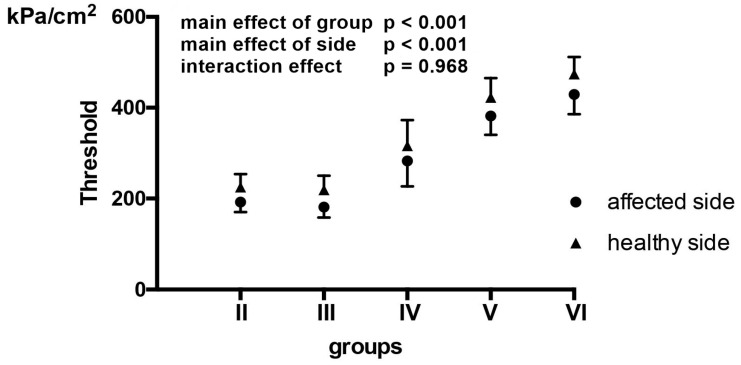
Figure 2.
Pain threshold values among patients with Bell’s palsy regarding the affected side. Pain threshold levels of the affected side (black dots) and the healthy side (black triangles) are presented as averages ± standard deviation (whiskers). Pain threshold was assessed by two-way ANOVA (factors: group—II, III, IV, V, VI; side—affected/healthy side). There was no interaction effect (p = 0.968), but a significant effect of group (p < 0.001) and side (p < 0.001).

