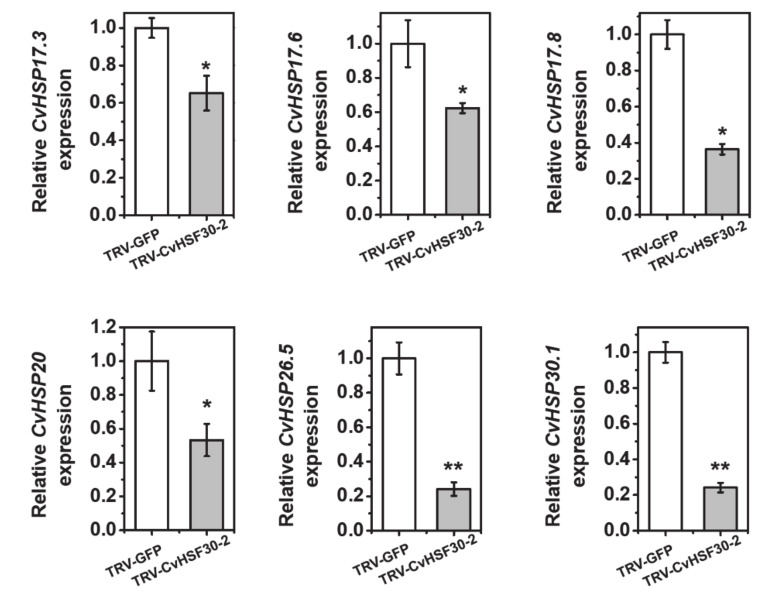
Figure 6.
Expressions of CvHSP17.3, CvHSP17.6, CvHSP17.8, CvHSP20, CvHSP26.5 and CvHSP30.1 in CvHSF30-2-silenced plants by VIGS. Error bars represent the standard error of three biological replicates. Asterisks indicate a significant difference between TRV-GFP and TRV-CvHSF30-2 by t-test. * p < 0.05; ** p < 0.01.

