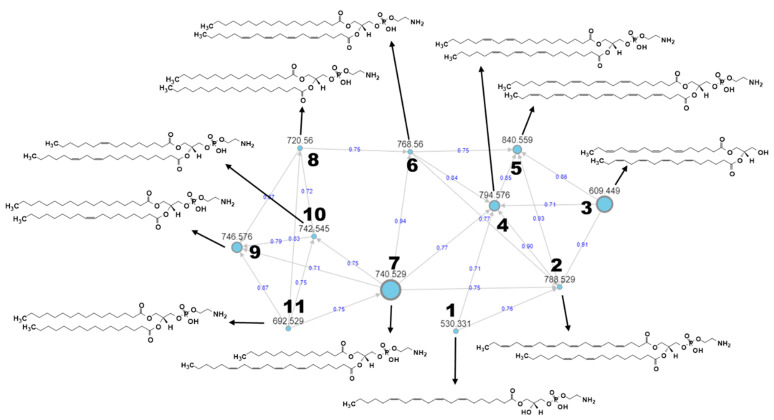
Figure 11.
MS/MS-based molecular networking from a cluster of glycerophospholipids and identifying 11 new structures as listed in Table 4. Nodes are labeled with parent m/z values, with different size corresponding to precursor intensity. Edges are labeled with cosine scores from 0 to 1.

