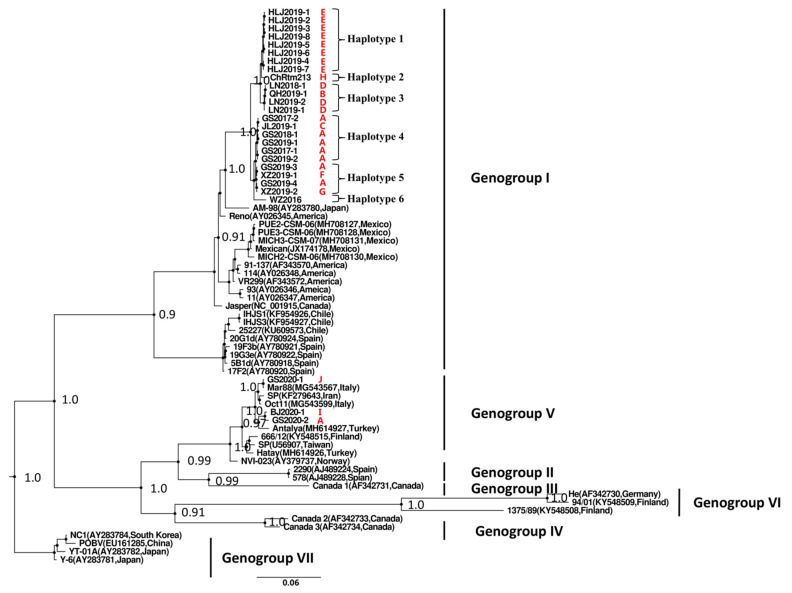
Figure 3.
Phylogenetic tree of IPNV isolates constructed based on the VP2 gene CDS by using Bayesian Inference method. The main nodes with pp value of higher than 0.9 are labeled. All of the Chinese IPNV isolates (red labels) clustered within genogroup I and V, respectively. Red capital letters indicated fish farms. Information of IPNV isolates used here was listed in Table 1 and Table 3.

