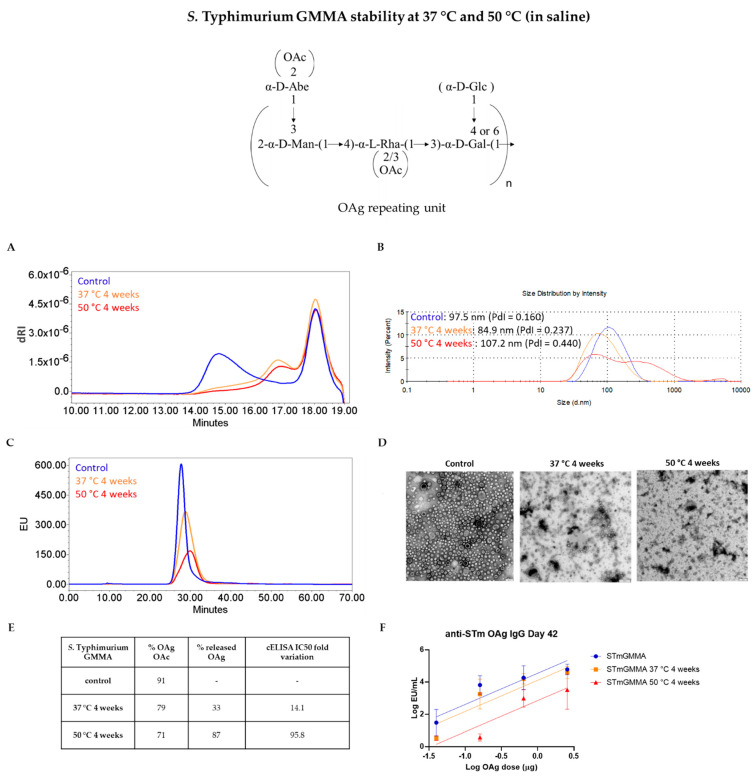
Figure 3.
Characterization of S. Typhimurium GMMA stressed for 4 weeks at 37 °C or 50 °C: (A) HPLC-SEC analysis of extracted OAg from GMMA samples; (B) DLS, (C) HPLC-SEC and (D) TEM analyses performed on GMMA: disruption and aggregation of GMMA start after one month at 37 °C with a worsening trend visible at the higher temperature of 50 °C (scale bar = 100 nm). (E) Summary table with OAg O-acetylation levels, percentage of OAg detached from GMMA membrane, and cELISA IC50 fold variation. (F) Stressed GMMA were tested in mice: animals were immunized at day 0 and 28 and anti-OAg IgG response determined by ELISA at day 42 in single sera from each group. The graph reports parallel lines (log transformed ELISA units vs. log transformed μg OAg dose) where Y-intercepts of the dose–response curves are compared (p-value = 0.0177).

