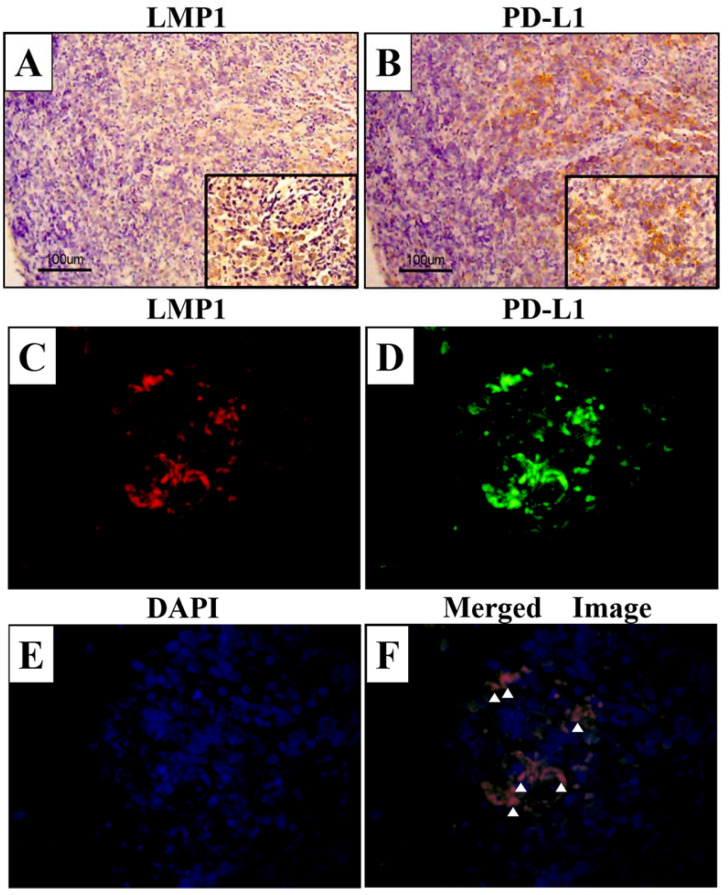
Figure 2.
LMP1 and PD-L1 expression in NPC tissue samples. The specimens were immunostained with LMP1 and PD-L1 antibody. Brown staining indicates positive cell membrane expression of LMP1 (A) and PD-L1 (B). Dual fluorescence immunostaining of LMP1 (C) and PD-L1 (D), and DAPI (E) in NPC tissue samples. (F) Merged image of LMP1 and PD-L1. White arrowheads indicate the colocalization of LMP1 and PD-L1. Original magnifications (A,B): ×100, inset figures: ×400, scale bar: 100 μm. Original magnifications (C–F): ×600.

