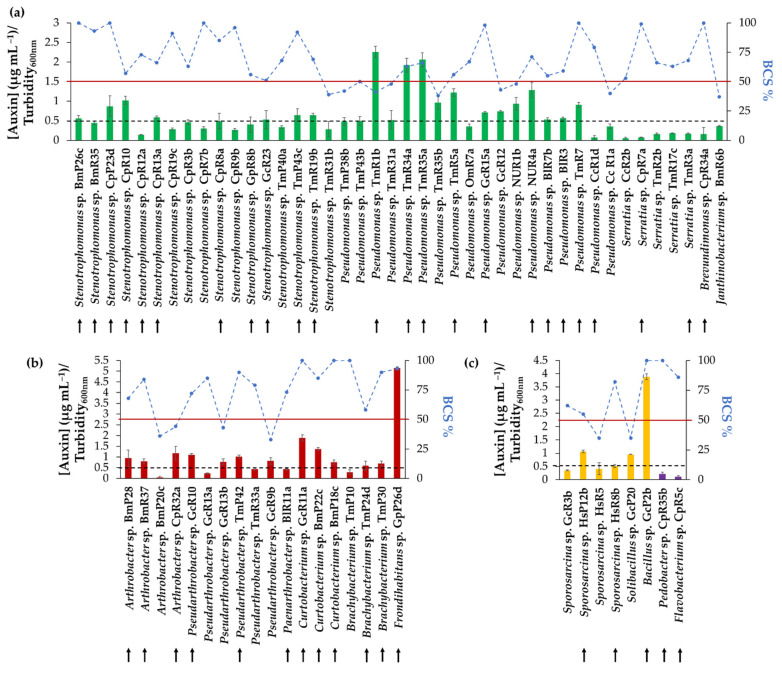
Figure 3.
Auxin production and bacterial cell survival percentage (BCS%) of bacterial strains. (a) Auxin production and BCS% of Proteobacteria (green bars). (b) Auxin production and BCS% of Actinobacteria (red bars). (c) Auxin production and BCS% of Firmicutes (yellow bars) and Bacteroidetes (purple bars). The blue dots (joined by dotted lines) represent BCS% of each isolate. The solid red line is the 50% BCS value. The dashed black line represents the value of [Auxin] (µg mL−1)/Turbidity600nm = 0.5 µg mL−1. Small black arrows indicate selected strains. Each value is a mean ± SD of three independent trials.

