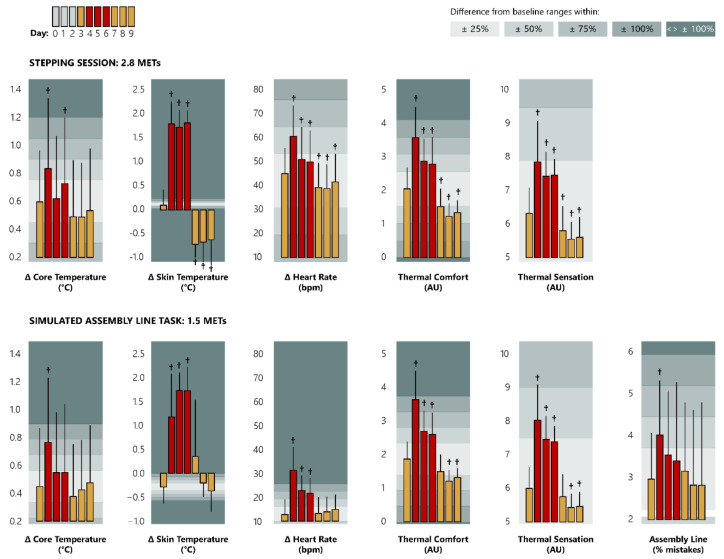
Figure 3.
Differences (means ± sd) in thermal strain and labour efficiency during stepping (top graph) and simulated assembly line task (bottom graph) between neutral and hot days. Data are presented as delta (Δ) differences from the pre-heat-wave sleep (sleep time of days 0–2), depicting the increase/decrease in the physiological strain experienced by our participants. Yellow and red bars correspond to the days pre-/post and during the heat-wave, respectively. The first yellow bar (day: 3) represents the average of each variable across the pre-heat-wave period (days 1–3). Grey areas in the background represent the magnitude (%) of difference compared to the pre-heat-wave variables. AU indicates arbitrary units. Cross signs indicate statistically significant differences compared to the pre-heat-wave period, at p < 0.05.

