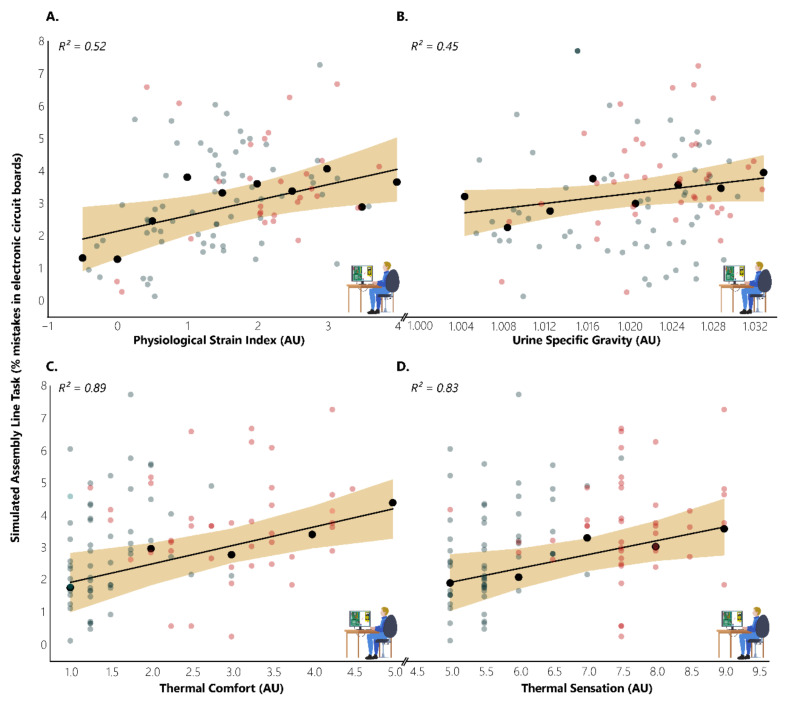
Figure 4.
Impacts of physiological strain (A), hydration status (B), thermal comfort (C), and thermal sensation (D) on labour productivity, as expressed by physiological strain index, urine specific gravity, and the subjective scales of thermal comfort and thermal sensation, respectively. AU indicates arbitrary units. Red and blue dots represent work during hot (35.4 °C) and neutral (25.4 °C) conditions, respectively. Black dots with their accompanied trendline and 95% CI (shaded area) depict the increase in the number of mistakes committed in electronic circuit boards for every 0.5 points in physiological strain index, 0.004 points in the urine specific gravity scale, and 1 point in the subjective scales of thermal comfort and thermal sensation.

