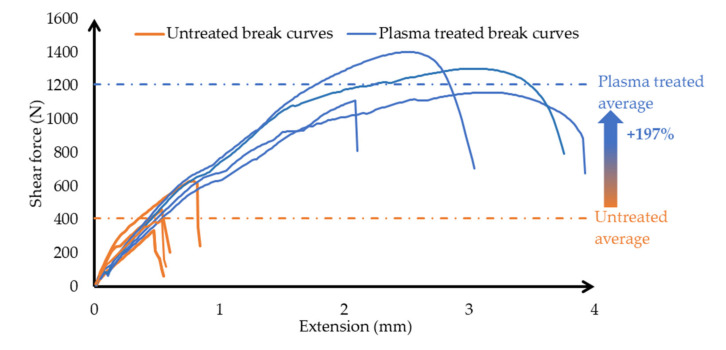
Figure 10.
The diagram shows the breaking test of overlapping bonded joints as a function extension, indicating separately the main features of the break curves of untreated and plasma-treated samples. The dotted lines show the average breaking strength of the untreated and treated surface bonded HIPS polymer pairs, and the increment is displayed.

