Figure 2.
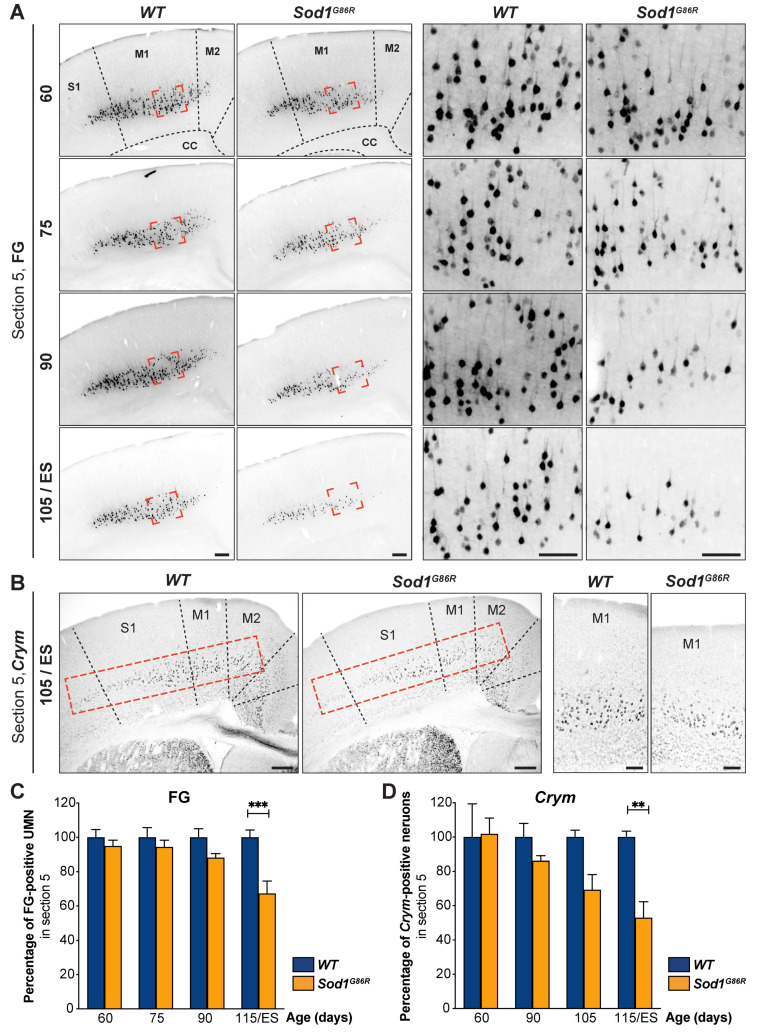
Progressive loss of UMN is confirmed by in situ hybridization. (A) Representative negative fluorescence images of brain coronal sections (Bregma 0.74 mm, corresponding to Section 5 for Figure 1) showing FG-labelled UMN in the cerebral cortex of WT and Sod1G86R mice of 60, 75, 90, and 105 days of age or end stage (ES). Red shapes indicate the positions where the close-ups of the right panels were acquired. (B) Representative images of in situ hybridization on brain coronal sections of ES Sod1G86R and 115 day-old WT control mice showing decreased Crym expression in the layer V of the cerebral cortex. Dotted red rectangles indicate the areas where Crym-positive neurons were counted. Close-ups are shown in the right panel. (C) Bar graph representing the percentage of FG-positive neurons in Sod1G86R mice (orange) relative to their WT littermates (blue) over time. (D) Bar graph representing the percentage of Crym-positive neurons in Sod1G86R mice (orange) relative to their WT littermates (blue) over time. N = 5 WT and 6 Sod1G86R at 60 days; 6 WT and 3 Sod1G86R at 75 days; 5 WT and 6 Sod1G86R at 90 days; 5 WT and 5 Sod1G86R at 105 days/ES (end stage). ** p < 0.01 and *** p < 0.001 in multiple comparisons test. Scale bars = 200 µm in the left panels and 50 µm in the right panels of (A,B). M1, primary motor cortex; M2, secondary motor cortex; S1, primary somatosensory cortex.

