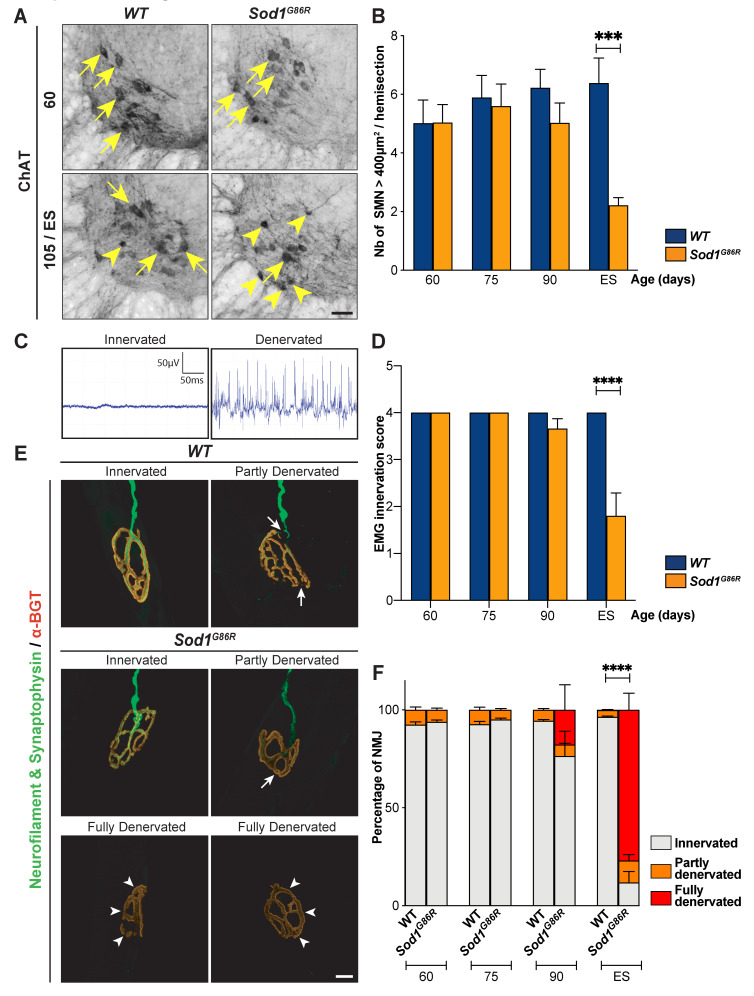
Figure 5.
In Sod1G86R mice, LNM degeneration starts after the loss of the first UMN. (A) Representative images of coronal sections of the spinal cord of WT and Sod1G86R mice at 60 and 105 days or end stage (ES), showing Choline AcetylTransferase-positive neurons (ChAT) present in the ventral horn. Arrows indicate large ChAT-positive neurons, arrowheads indicate smaller or shrinked ChAT-positive neurons. (B) Bar graph representing the average number of large ChAT-positive neurons, with an area ≥ 400 µm2, counted in the ventral horn of lumbar spinal cord sections from WT (blue) and Sod1G86R mice (orange) at 60, 75, 90, and 105 days of age or ES. (C) Representative electromyography recordings of an intact, innervated muscle (left), and of a denervated muscle presenting fasciculations (right). (D) Bar graph representing the EMG innervation scores calculated for Sod1G86R and WT mice. (E) Representative maximum intensity projection images of z-stacks of typical innervated, partly or fully denervated neuromuscular junctions (NMJ) from 90 day-old Sod1G86R and WT mice upon labelling of presynaptic elements with neurofilament and synaptophysin (green) and postsynaptic elements with alpha-bungarotoxin (α-BGT, red). (F) Bar graph representing the average proportions of innervated (grey), partly denervated (orange), or fully denervated (red) NMJ upon staining and microscopy analysis of one tibialis anterior muscle of WT and Sod1G86R mice at 60, 75, 90, and 105 days of age or end stage (ES). N = 5 WT and 6 Sod1G86R at 60 days; 6 WT and 3 Sod1G86R at 75 days; 5 WT and 6 Sod1G86R at 90 days; and 5 WT and 5 Sod1G86R at 105 days/ES. *** p < 0.001 and **** p < 0.0001 in multiple comparisons test (B,D) and multiple t tests (F). Scale bar = 50 µm in (A) and 10 µm in (E).

