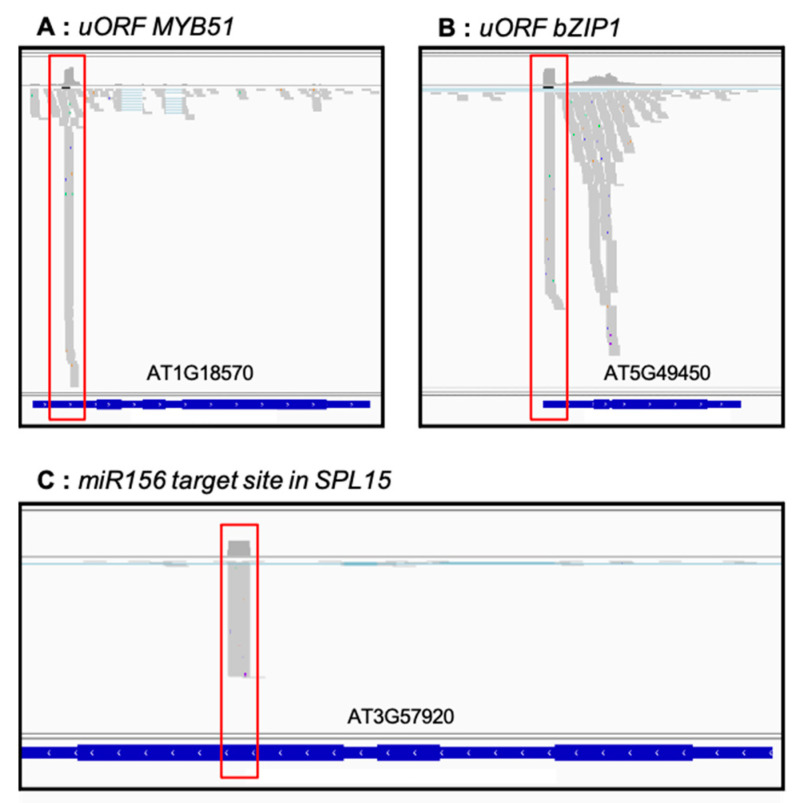
Figure 6.
5′P degradome data allows identification of ribosome stacking at uORF or 5′P reads accumulation at miRNA cleavage site. Genome viewer of 5′P reads accumulation along At1g18570 (A), At5g49450 (B) and At3g57920 (C). Regions corresponding to uORF or miRNA cleavage site are highlighted in red. Grey marks correspond to 5′P reads accumulation.

