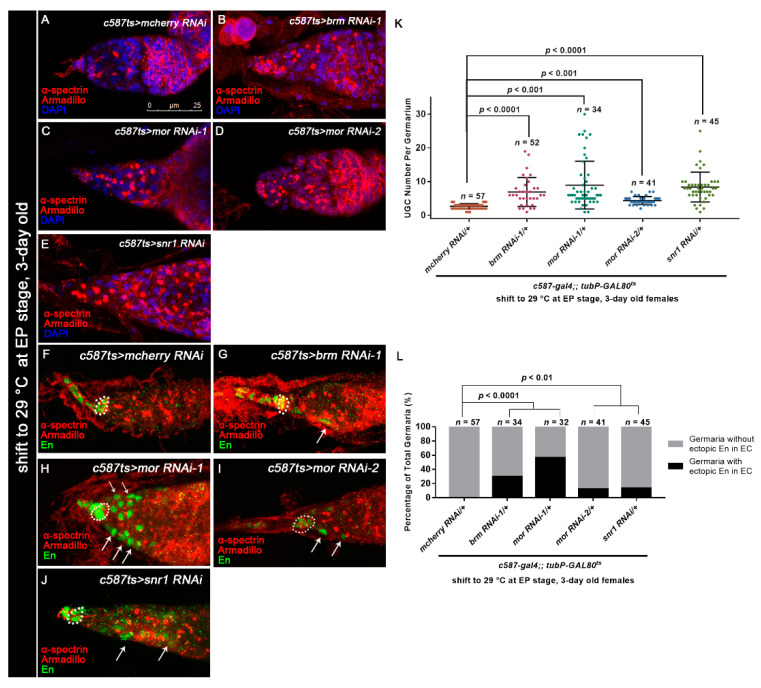
Figure 6.
Osa functions in a BAP complex-dependent manner. (A–E) Germaria stained for α-spectrin (red), Armadillo (red), and DAPI (blue). c587-gal4;;tubP-GAL80ts was used for BAP complex component KD. The germarium from the control group (A) exhibited a normal number of CBs. The c587ts > brm RNAi-1 (B), c587ts > mor RNAi (C,D), and c587ts > snr1 RNAi (E) germaria exhibited UGC accumulation. (K) Graph showing the quantification of UGCs in each germarium. Error bars are presented as the Mean ± SD. (F–J) c587-gal4;;tubP-GAL80ts was used for BAP complex component KD. Germaria were stained for α-spectrin (red), Armadillo (red), and En (green). CpCs are indicated by white dashed circles. Germaria from the control group (F) exhibited exclusive expression of En in TF and CpCs. Germaria from c587ts > brm RNAi-1 (G), c587ts > mor RNAi (H,I), and c587ts > snr1 RNAi (J) exhibited ectopic En expression in ECs (indicated by white arrows) in addition to CpCs. (L) Graph showing the percentage quantification of germaria with En ectopic expression. Several compressed z-sections are shown in (A–J). The scale bar is shown in (A).

