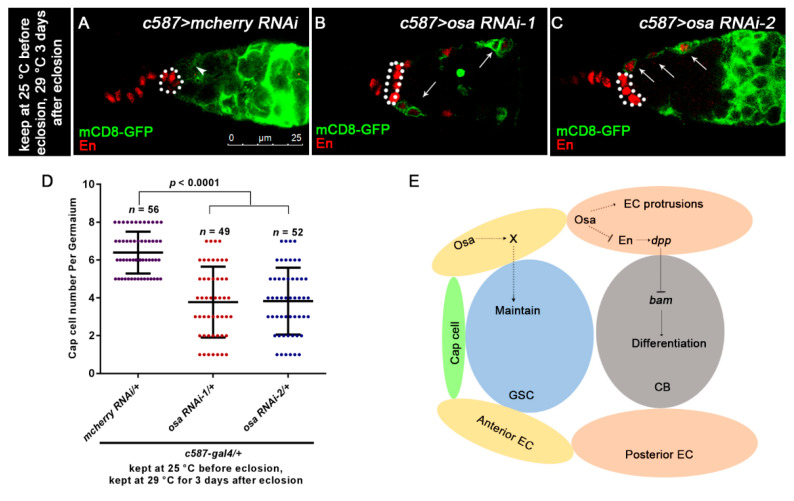
Figure 7.
Osa regulates EC characteristics. (A,C) Germaria are stained for En (red) and GFP (green). EC membranes are marked by mCD8-GFP (detected by GFP). CpCs are indicated by white dashed circles. In control germarium (A), EC protrusions extend between cysts (indicated by white arrowhead). Additionally, en is exclusively expressed in TF and CpCs. In osa RNAi-1, osa RNAi-2 germarium (B,C), ECs lose their cellular processes (indicated by white arrows). Additionally, en is ectopically expressed in ECs, which is also marked by GFP (indicated by white arrows). (D) Graph shows the quantification of CpC per germarium. Error bars are presented as Mean ± SD. (E) Model illustrates Osa-mediated regulation of GSC maintenance and germ cell differentiation in ECs in germaria. Scale bar is shown in (A).

