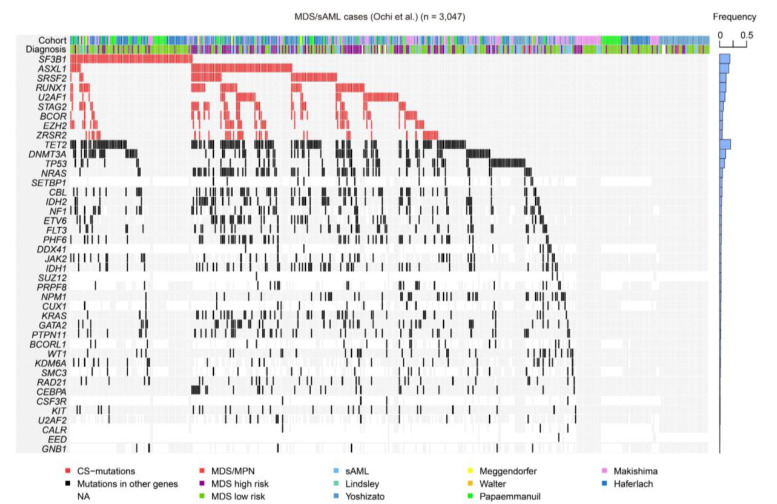
Figure 5.
CS-mutations in MDS/sAML. A heatmap representing the mutations found in a large cohort of MDS, related myeloid disorders, and sAML, as shown in our previous study [22]. Blue bars on the right show frequencies of mutations in all cases. MPN, myeloproliferative neoplasm; NA, not available.

