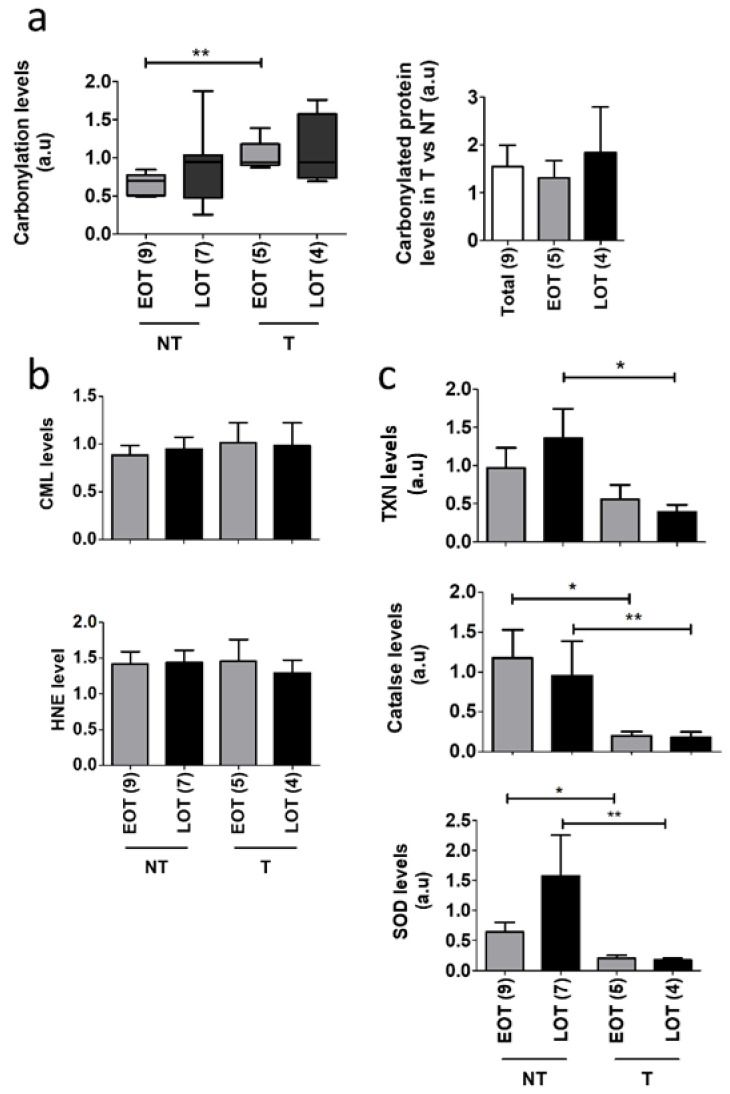
Figure 3.
Oxidative stress damages in EOT vs. LOT. (a) Left panel: In-gel analysis of total protein carbonylation levels of non-tumor (NT) and tumor tissues (T) from early-onset patients (EOP) and late-onset patients (LOP) normalized by total protein input. Right panel: carbonylated protein rates of T compared to NT in EOP and LOP. Representative in-gel protein deposits are displayed in Figure S5a; (b) N(6)-Carboxyl-methyl-lysine (CML) and 4-Hydroxynonenal (HNE) levels quantified by Western blot and normalized by total protein expression (“stain-free” Biorad® technology). Representative stain-free membranes, HNE, and CML Western blots are displayed in Figure S5b,c, (c) Thioredoxin (TXN), catalase, and superoxide dismutase (SOD) antioxidant protein expression normalized to β-Actin expression was analyzed by Western blot from EOP and LOP. Representative blots are displayed in Figure S5d, t test: * p < 0.05; ** p < 0.01.

