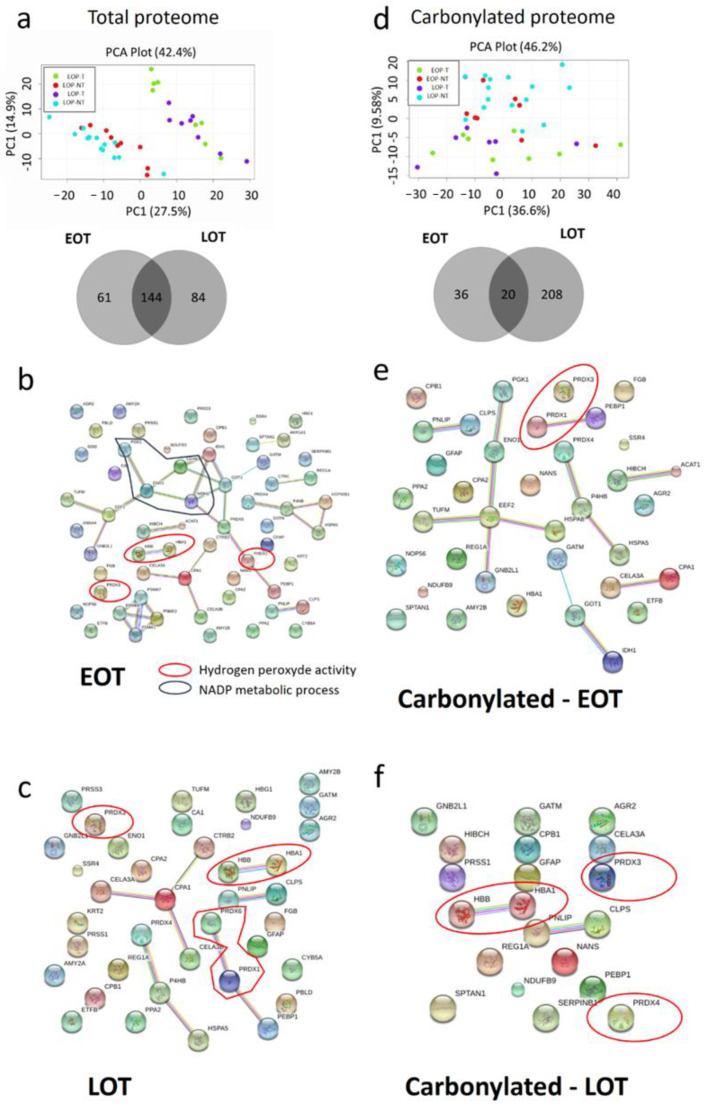
Figure 4.
Specific protein damages in tumor tissues (T) compared to non-tumor tissues (NT) in early-onset patients (EOP) and late-onset patients (LOP). (a) Principal component analysis (PCA) of total protein expression from each spot analyzed by 2D-DIGE. Lower panel: Venn diagram of specific spots from EOP and LOP, (b) PCA of carbonylated protein expression from each spot analyzed by 2D-DIGE. Lower panel: Venn diagram of specific spots from EOP and LOP. (c–f)—String software analysis of significant differential proteins (c) Down regulated in EOP; (d) Down regulated in LOP; (e) More carbonylated in EOP; (f) More carbonylated in LOP.

