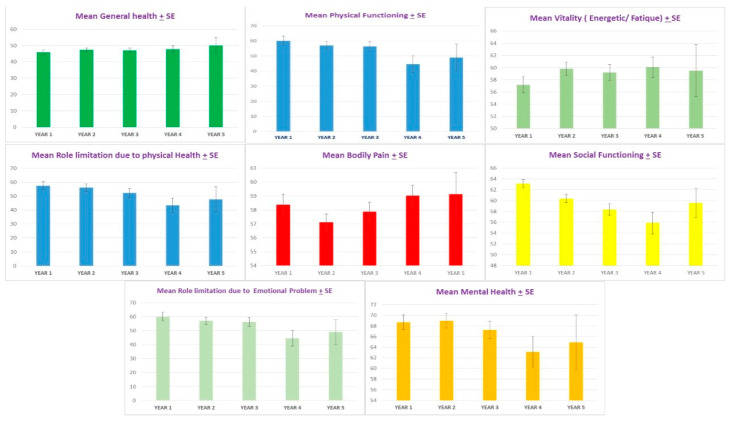
Figure 4.
The mean ± standard error (SE) by year of general health subdomain of SF-36 (top left) showed significant improvement from baseline across five years (p = 0.02). The mean ± standard error (SE) by year of physical health subdomain of SF-36 (top middle), physical functioning subdomain of SF-36 (top middle), and emotional subdomain of SF-36 (bottom left) showed significant worsening at 4–5 years (p = 0.04, p = 0.03, and p = 0.03, respectively). The mean ± standard error (SE) by year of social functioning subdomain of SF-36 (right middle), bodily pain subdomain of SF-36 (middle), the mean + standard error (SE) health subdomain of SF-36 (bottom right), and vitality subdomain of SF-36 (top right) showed no significant changes across the five years of treatment (p = 0.56, 0.94, 1.00, and 0.56, respectively).

