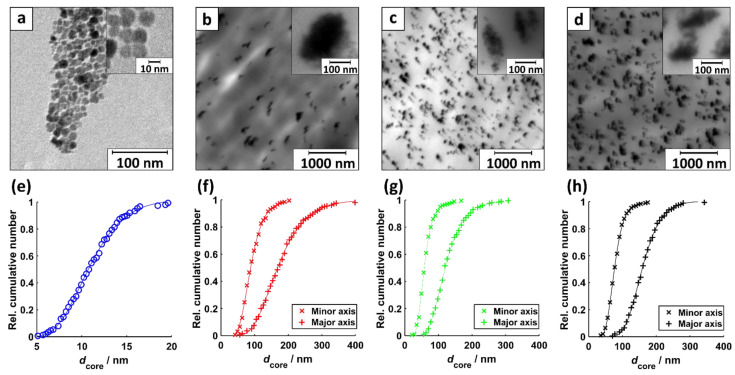
Figure 2.
TEM images of (a) MNP disp, (b) MNP inside PP@3%MNP, (c) PP@5%MNP, and (d) PP@7%MNP filaments. The insets show an exemplary magnification of one part of the same image. The corresponding core diameter distribution with a fit to a log-normal CDF of (e) spherical shaped dispersed MNP (R2 = 0.9987), (f) minor and major axis of ellipsoidal shaped MNP agglomerated inside PP@3%MNP (R2min = 0.9984, R2maj = 0.9992), (g) PP@5%MNP (R2min = 0.9991, R2maj = 0.9991), and (h) PP@7%MNP filaments (R2min = 0.9995, R2maj = 0.9992).

