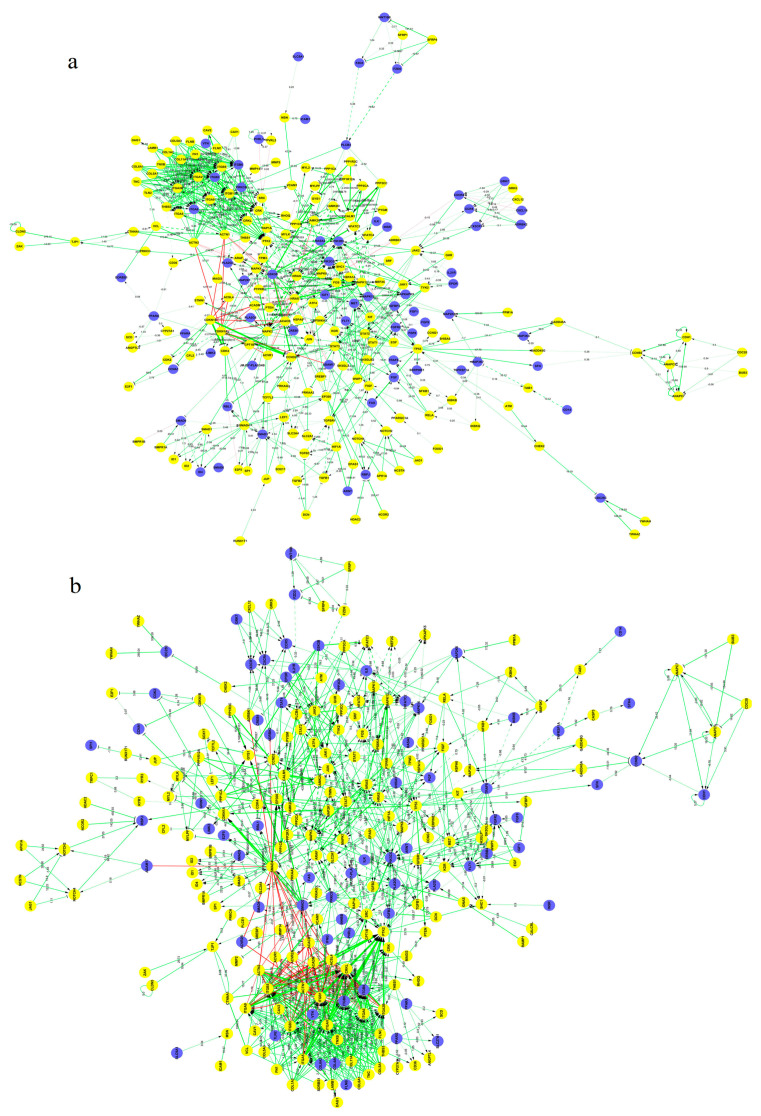
Figure 4.
The interaction network of differentially expressed genes (DEGs) regulating myogenesis in Landrace (LR) (a) and Lantang (LT) (b) pig breeds. Yellow and blue dots represent DE and non-DE genes, respectively. Straight lines represent interaction association between genes. Solid and dashed lines represent direct and indirect interaction, respectively. Value and diameter of lines represent the interaction size [138].

