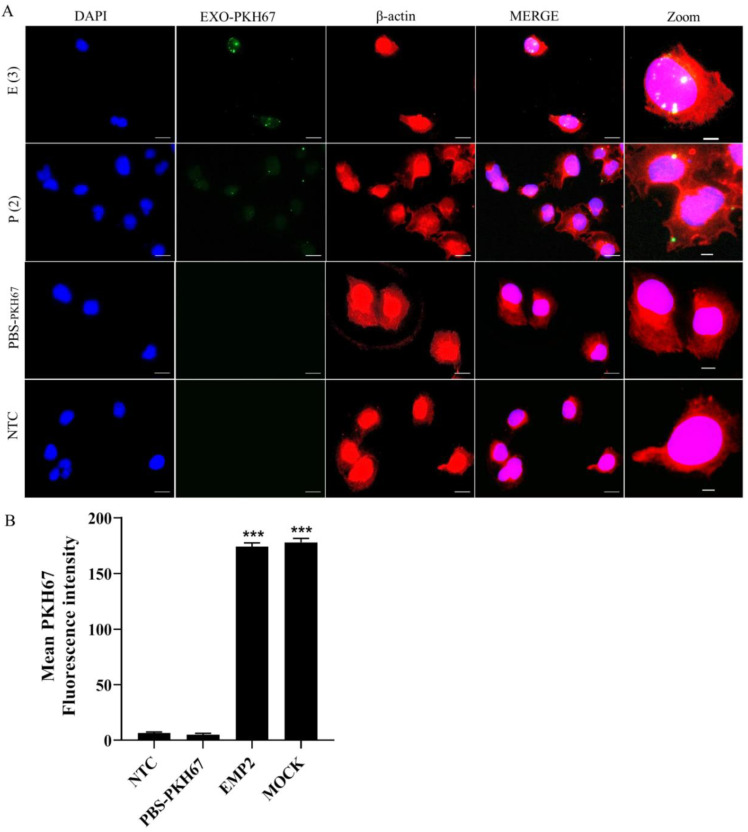
Figure 8.
Uptake of exosomes by autologous cells. (A) Cellular uptake of autologous exosomes in H2170 cells imaged by confocal microscopy. The fluorescence of DAPI, β-actin, and that of EXOSOME-PKH67 are labeled with blue, red, and green, respectively. Scale bars: 10 µm. (B) Summary bar graphs of the relative mean fluorescence intensity (MFI) of PKH67 (exosomes) in recipient cells. The results are illustrated as the mean ± SEM of the relative MFI. *** p < 0.001 in comparison with nontreated cells (NTC) analyzed by one-way ANOVA with Bonferroni’s multiple comparisons test; E-Mock: Exosome of mock cells; E-EMP2: Exosomes of EMP2-transfected cells.

