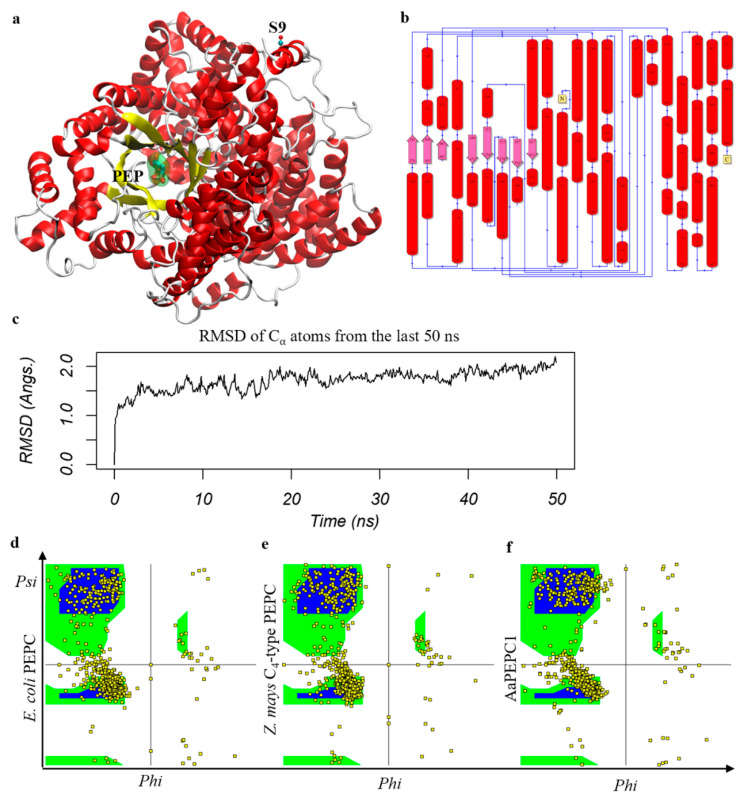
Figure 2.
AaPEPC1 binds to phosphoenolpyruvate (PEP) substrate. (a) Left: AaPEPC1 structure selected from 200 ns molecular dynamics (MD) simulation that is closest to the average structure of the whole trajectory (root mean square deviation RMSD = 0.8 Å). The protein structure is shown in cartoons with helices in red, strands in yellow and coils/turns in white. A PEP substrate that binds to the β-barrel (yellow) active site is shown in sticks and spheres. The plant-specific N-terminal serine residue (S9) is also shown. The binding position of the PEP substrate was obtained from the Escherichia coli PEPC–PEP complex (PDB entry 1JQN) [50]. (b) A cartoon representation of the topology of AaPEPC1 structure. The cylinders represent alpha-helices. (c) The RMSD (Å) profile of the final 50 ns of the MD simulation. The deviations of all snapshots to the average MD structure are 1.4 ± 0.2 Å (not shown). (d–f) Ramachandran plot of the E. coli (PDB entry 1JQN) PEPC, Zea mays C4-type PEPC (PDB entry 5VYJ) [49], and AaPEPC1 (the final snapshot of the 200 ns MD trajectory), respectively.

