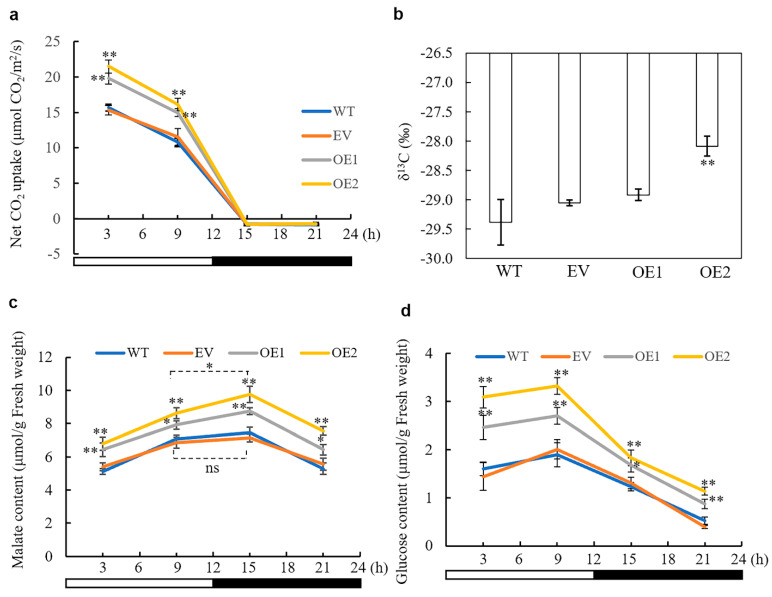
Figure 3.
Impact of overexpressing AaPEPC1 on photosynthetic rate (a), carbon isotope ratio δ13C (b), malate content (c), and glucose content (d) in tobacco. OE1 and OE2: the transgenic plants expressing AaPEPC1. EV: empty vector control. WT: wild-type plants. White and black bars indicate the light period (12 h) and the dark period (12 h), respectively. X-axis represents the time after the beginning of the light period at 00:00 h. Values represent means ± SD (n = 3 individual replicate plants). * and ** indicated significant difference from that of WT at p < 0.05 and p < 0.01, respectively, by one-way ANOVA analysis with a post-hoc Tukey honestly significant difference (HSD) test. Ns = non-significant.

