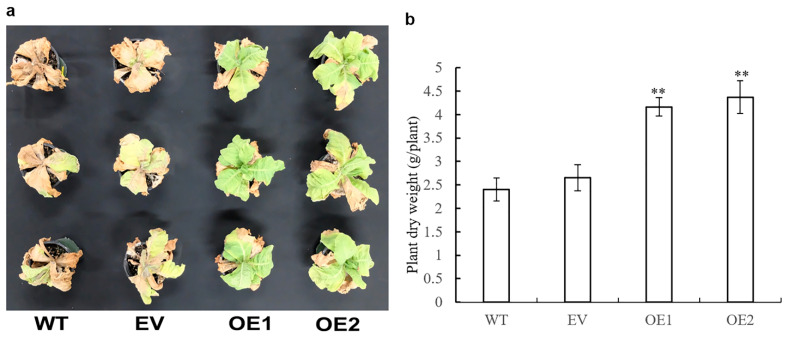
Figure 6.
Responses of the AaPEPC1-overexpressing tobacco plants under salt stress. (a) Phenotypes of transgenic plants expressing AaPEPC1 (OE1, OE2) or empty vector (EV), and wild-type plants (WT) grown in pots under 200 mM NaCl stress. The plants were irrigated with 200 mM NaCl solution once every 2 days for 4 weeks. (b) Dry weight of transgenic plants and WT. Values represent means ± SD (n = 3). ** significant difference from that of WT p < 0.01, by one-way ANOVA analysis with post-hoc Tukey HSD.

