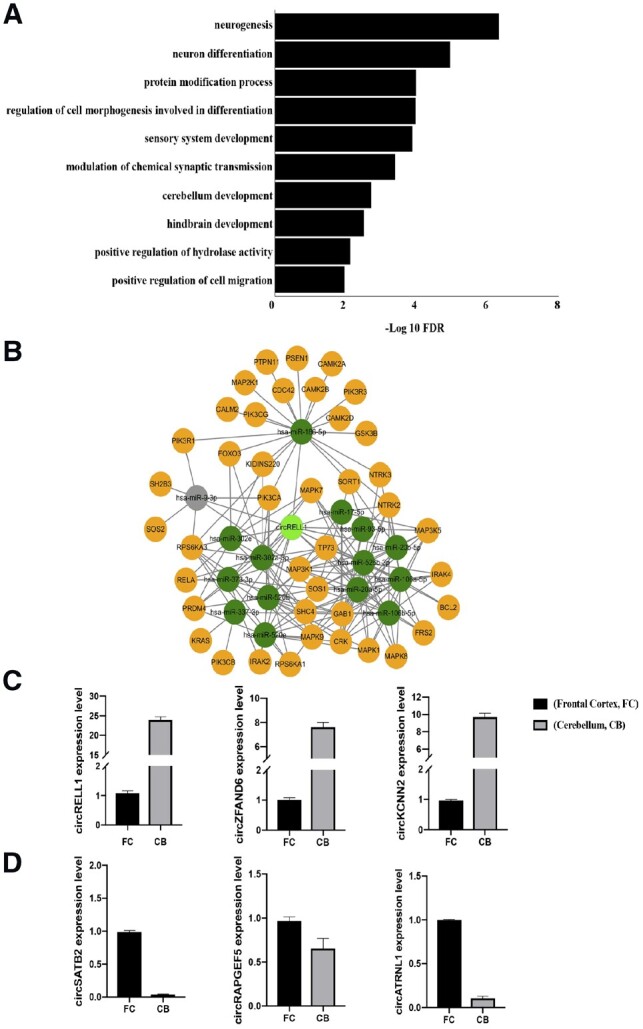
Fig. 3.

(A) Gene ontology (GO) analysis using host genes harboring circRNAs expressed higher in cerebellum than infrontal cortex. Bar charts showing selected biological processes ranked by false discovery rate (FDR) (FDR <0.05). (B) The putative miRNAs that could be sponged by circRELL1 are predicted by starBase database and indicated in dark green. The mRNAs regulated by miRNA changes are shown in yellow. miRNAs that are not expressed in corresponding tissues are marked in gray. The circRNA-miRNA–mRNA network is related to neurotrophin signaling pathway. (C) The expression of three cerebellum enriched circRNA predicted by circMeta, namely circRELL1, circZFAND6 and circKCNN2, is experimentally validated by RT-qPCR. (D) The expression of three frontal cortex enriched circRNA predicted by circMeta, namely circSATB2, circRAPGEF5 and circATRNL1, is experimentally validated by RT-qPCR
