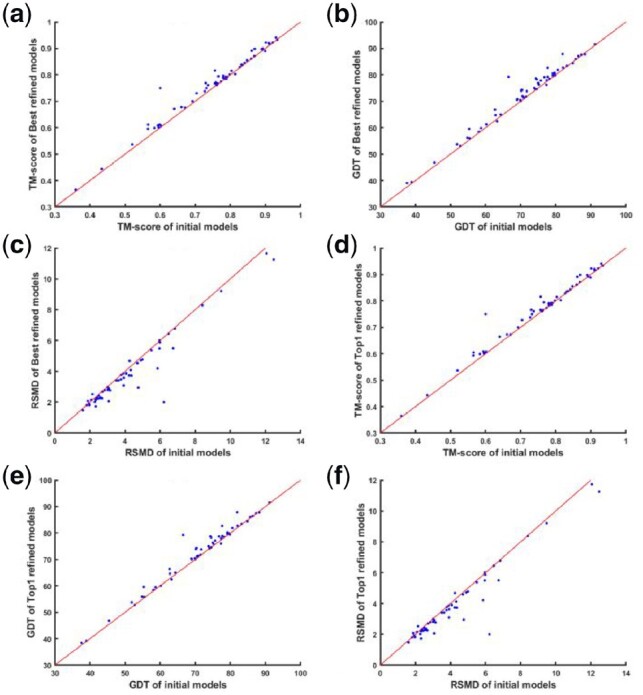
Fig. 3.

The comparison of AIR’s refined models with the initial models. The comparison of the best model refined by AIR and the initial model in terms of TM-score, GDT_TS and RSMD are shown in (a), (b) and (c), respectively. On the other hand, the comparison of the AIR refined model 1 and the initial model in terms of TM-score, GDT_TS and RSMD are presented in (d), (e) and (f) respectively
