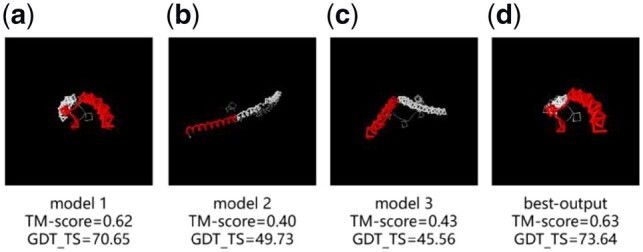
Fig. 8.

Comparison of different models of R0979 and the experimental structure. (a) initial model 1, (b) initial model 2, (c) initial model 3 and (d) AIR first model. Residues with d < 5Å in red and residues with d > 5Å in white. (Color version of this figure is available at Bioinformatics online.)
