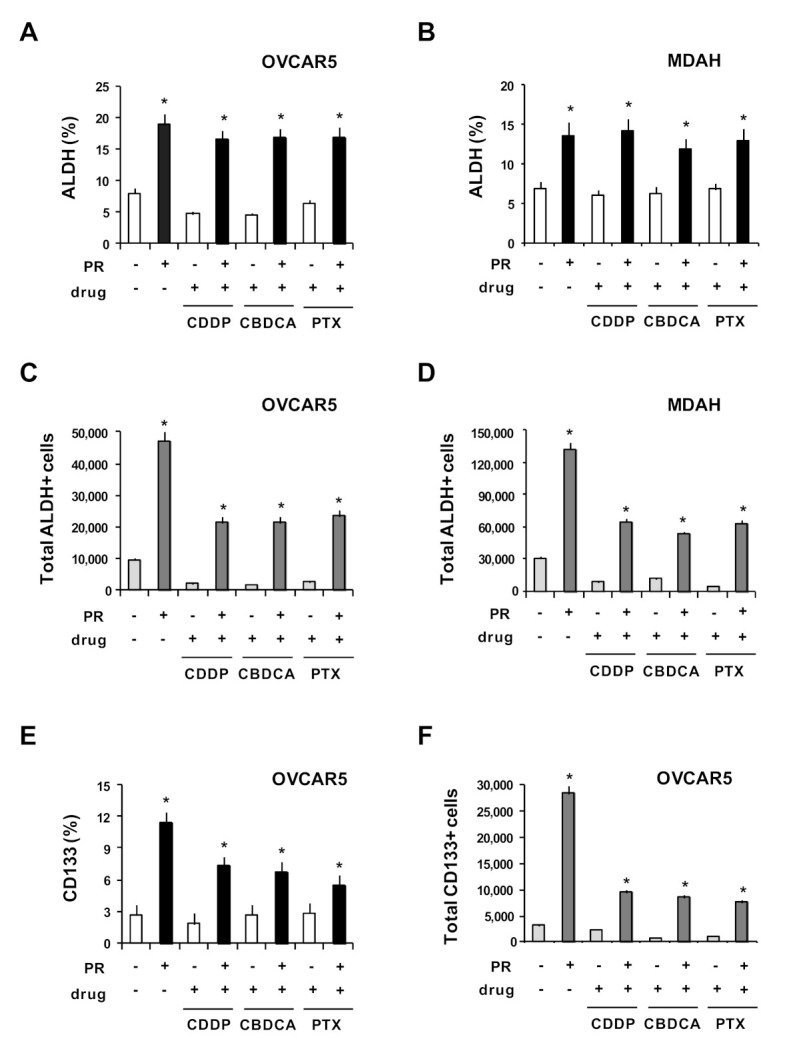
Figure 6.

PR increased ALDH- and CD133-positive cells after drug treatment. OVCAR5 and MDAH cells were cultured for 5 days with PR (10%) in non-adherent conditions to form spheroids. Then cells were treated with CDDP, CBDCA and PTX for an additional 3 days. Treated cells were dissociated into single-cell suspensions by means of trypsinization. Histograms show the percentage of ALDH positive cells in OVCAR5 (A) and MDAH (B). Number of OVCAR5 (C) and MDAH (D) ALDH-positive cells. Histograms showing the percentage (E) and the number (F) of OVCAR5 CD133-positive cells. Data are expressed as mean ± SD of three replicates with three different PR pools and represent the percentage with respect to the control medium. * p < 0.01 (untreated vs. PR treated cells).
