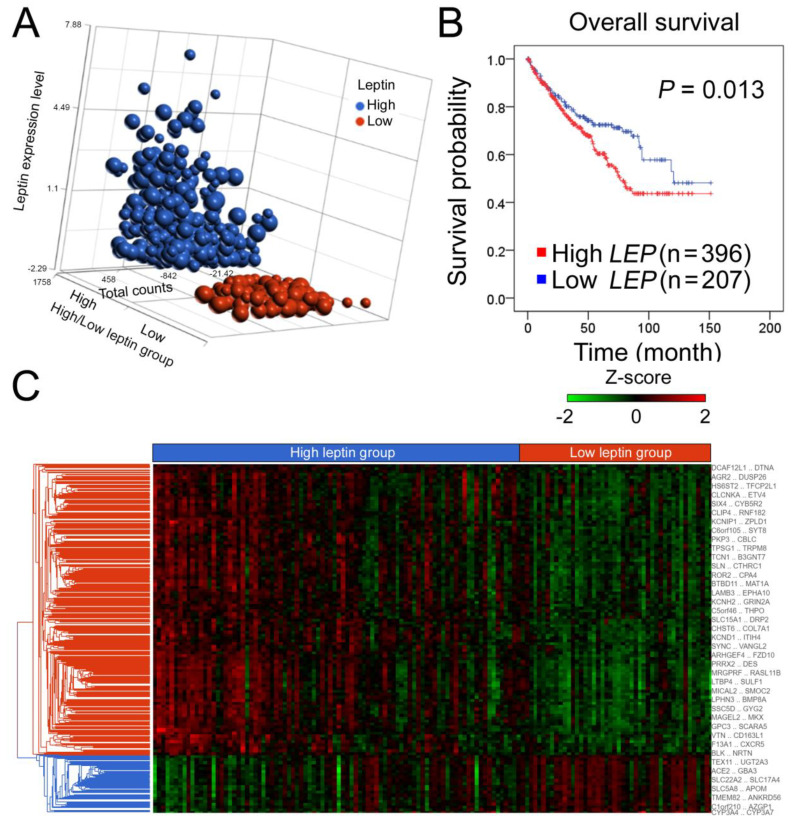
Figure 1.
Correlation of leptin with clinical outcomes and hierarchical clustering of gene signatures based on leptin levels. The gene expression profile in the dataset of kidney renal clear cell carcinoma (KIRC) (dataset ID: Table 2. PANCAN) was determined by RNA-Seq platform (Illumina HiSeq). (A) Relative leptin and transcriptomic read counts (total counts) of clear cell renal cell carcinoma (ccRCC) patients in the leptin high/low groups; 603 cases were stratified to 396 cases in high-leptin group and 207 cases in low-leptin group. Size of dot indicates the relative case number of patients. (B) Kaplan–Meier analysis of leptin expression under the condition of overall survival probability in ccRCC patients. (C) Hierarchical clustering of genes in the high and low leptin groups. Z-scores were computed on a gene-by-gene basis by subtracting the mean and then dividing by the standard deviation.

