
Fig. 3:
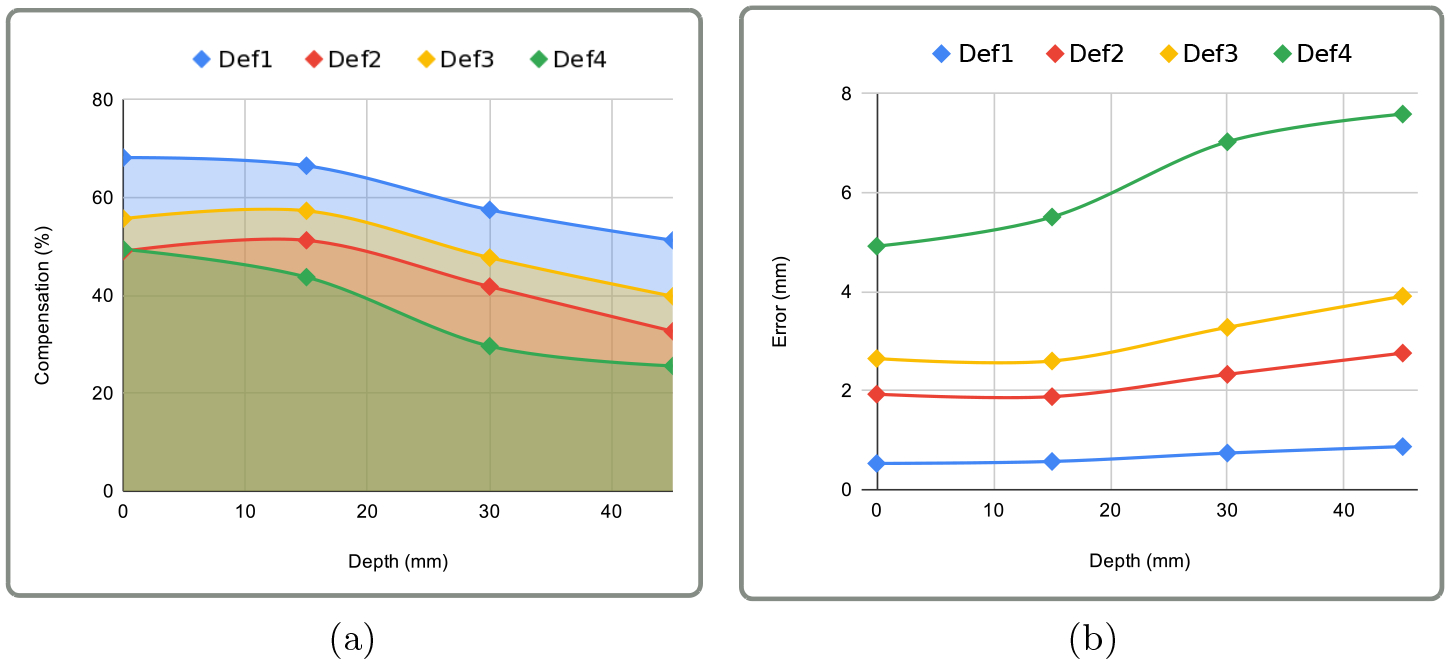
Quantitative evaluation on simulated data: Charts (a) and (b) show the percentage of compensation and target registration error respectively w.r.t to depth and brain shift amplitude. The depth axis correspond to the position of the target in the brain where 0mm represent the cortical surface and 45mm the deep brain.