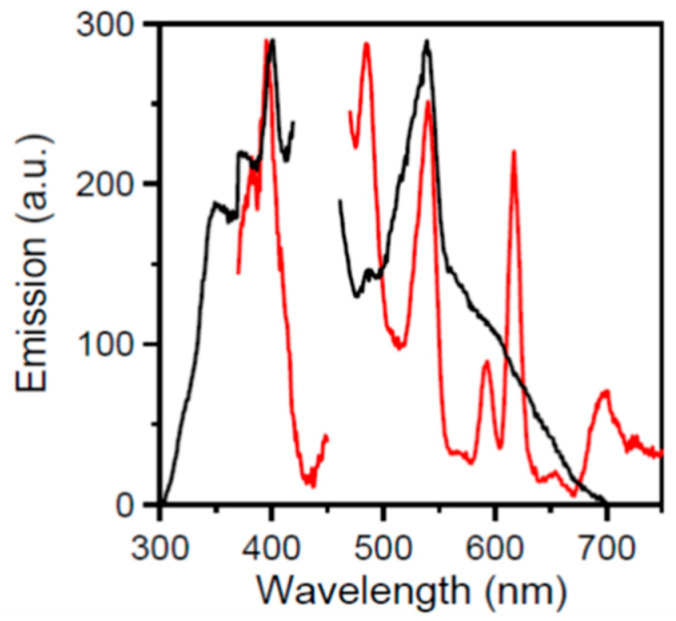
Figure 8.
Solid-state, room-temperature excitation (left) and emission (right) spectra of mepaoH (black curves) and complex 2 (red curves). The emission spectra were detected at 397 nm for both compounds. The excitation spectra were detected with maximum emission at 545 nm for mepaoH and 618 nm for 2.

