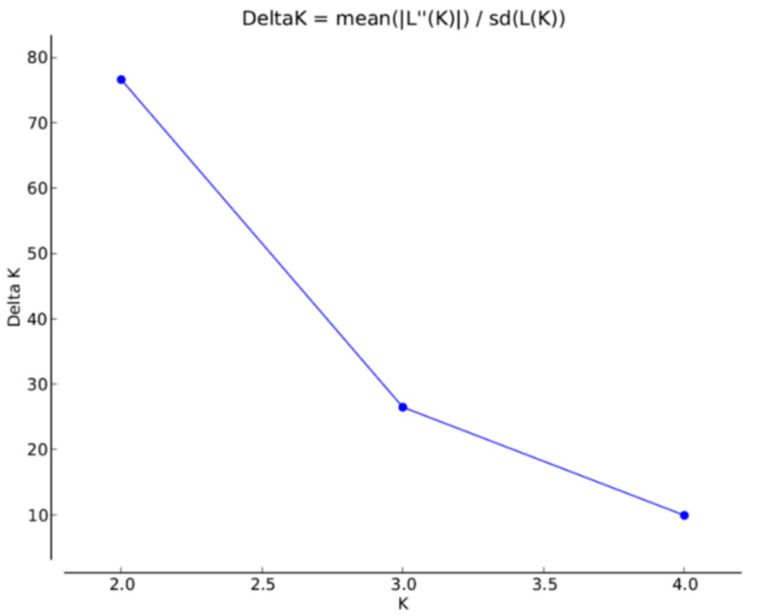
Figure 3.
ΔK calculated by the Evanno method [33] showing the K value that had the highest rate of change in log likelihood, here K = 2. The test was performed with VNTR data of all 562 clone corrected Fusarium graminearum isolates with the number of simulated populations (K) ranging from 1 to 5, with 10 replications for each K value.

