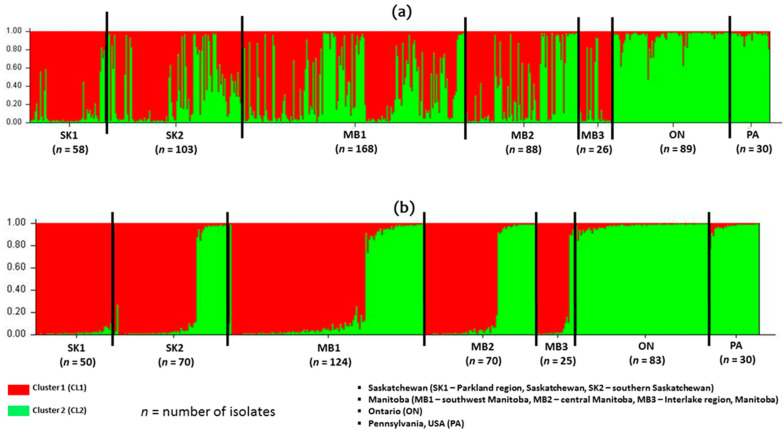
Figure 4.
Population structure and admixture estimates of 562 clone corrected Fusarium graminearum isolates based on geographic locations (a) All 562 isolates (b) Isolates with membership proportion greater than 0.8 for both CL1 and CL2. Vertical bars represent individual isolates colored to represent the estimated proportion of K membership of each isolate, which ranged from 0 to 1. Each bar represents one isolate.

