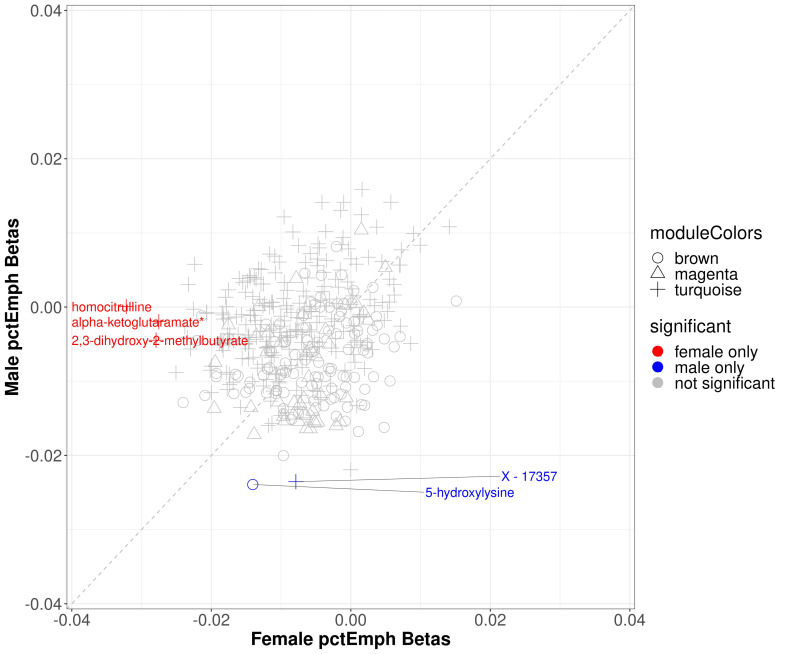
Figure 5.
Scatter plot of sex specific betas in percent emphysema. The x-axis represents the beta estimates in the female stratum while the y-axis represents the beta estimates in the male stratum. Point shape corresponds with module assignment. Points are colored by significance in specific strata.

