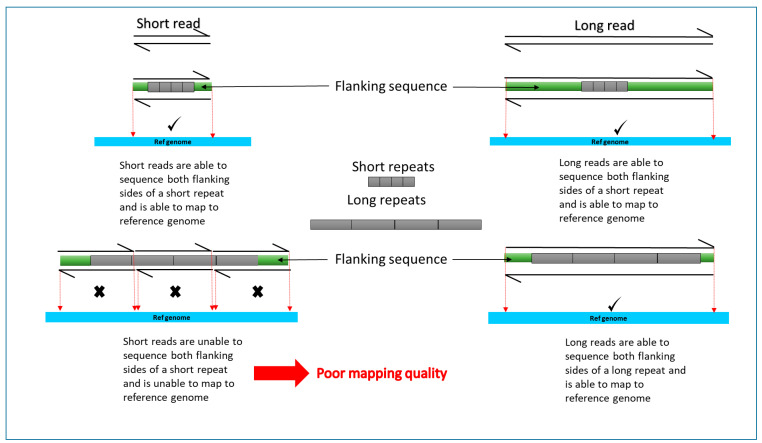
Figure 2.
A simplified, schematic diagram comparing short read and long read mapping to reference genome for long and short repeats. Sequencing reads are indicated by partial arrows. Grey rectangles represent target sequence. Flanking sequence is represented by green rectangles. Reference genome used to align the reads is indicated in blue. Reads poorly or not aligned to the reference genome are indicated by X. Success in mapping to reference genome indicated by a tick.

