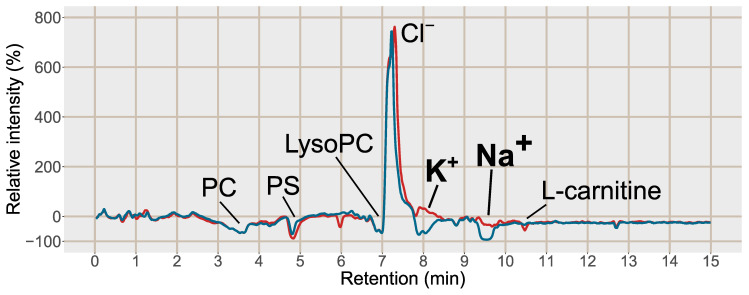
Figure 3.
Post-column infusion chromatogram of guanine (2*13C, 15N) with the relative intensity in % as compared to the injection of a solvent blank on the y-axis 100*(IntensityMCX or PPT/Intensityblank) − 100. Blue line = injection of blood plasma treated with PPT, red line = injection of blood plasma treated with SPE MCX. Each line is based on the average of 3 samples of each type, PPT, SPE MCX or a solvent blank. Major suppressions/enhancements are annotated in the chromatogram, PC = phosphatidylcholines, PS = phosphatidylserines, LysoPC = Lysophosphatidylcholines, K+ = potassium formate cluster K+(HCOOK), m/z 122.926, Na+ = sodium formate cluster Na+(HCOONa)3), m/z 226.954, Cl− = potassium chloride cluster, K+(KCl), m/z 112.8963.

