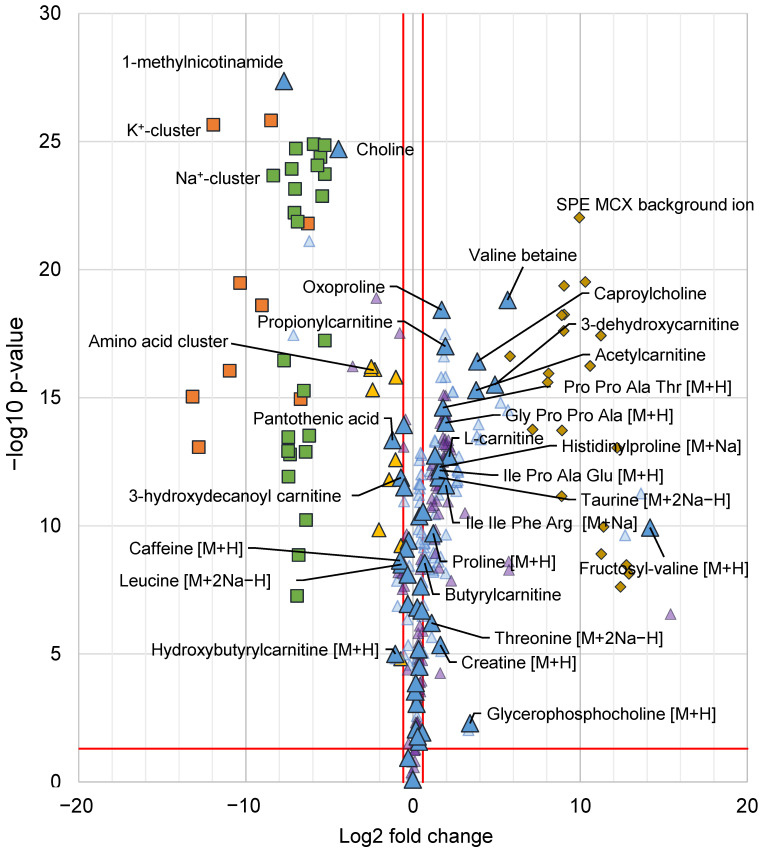
Figure 6.
Volcano plot with all annotated features from the multivariate data analysis, indicated as differentiating between the SPE MCX and PPT samples. X-axis shows log2 fold change and the y-axis -log10 p-value from a unpaired t-test. A positive log2 fold change indicates higher intensity in the SPE MCX samples and negative log2 fold change indicates a higher intensity in PPT samples. Metabolites are denoted by triangles, for each annotated metabolite the [M+H]+ or corresponding signal is denoted by a large blue triangle (depending on which ions were detected), fragment ions or isotopes are denoted by smaller light blue triangles, adducts are denoted by small purple triangles. All metabolites with a fold change corresponding to 1.5 or more and a p-value < 0.05 (indicated by red lines) are labelled with their respective annotation. K+ clusters (K+(HCOOK)n) denoted by orange squares (■), Na+ clusters (Na+(HCOONa)n) are denoted by green squares (■), clusters containing amino acids are denoted by yellow triangles (▲). Background ions from the SPE cartridges are denoted by dark yellow diamonds (♦). All annotated features can be found in Supplementary Data Tables S5 and S6.

