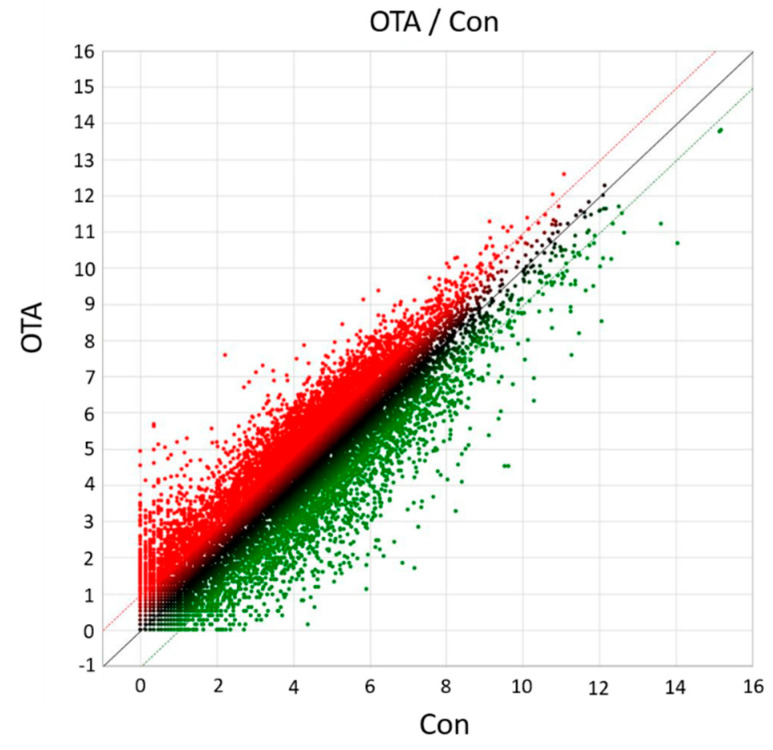
Figure 2.
The scatter plot of DEGs between Con and OTA treatment groups. The X-axis indicates the log2 expression values in Con group, and the Y-axis indicates the log2 expression values in OTA group. Each point indicates a particular gene or transcript. Red dots indicate up-regulated genes, green dots indicate down-regulated genes, and black dots indicate genes showing nonsignificant changes.

