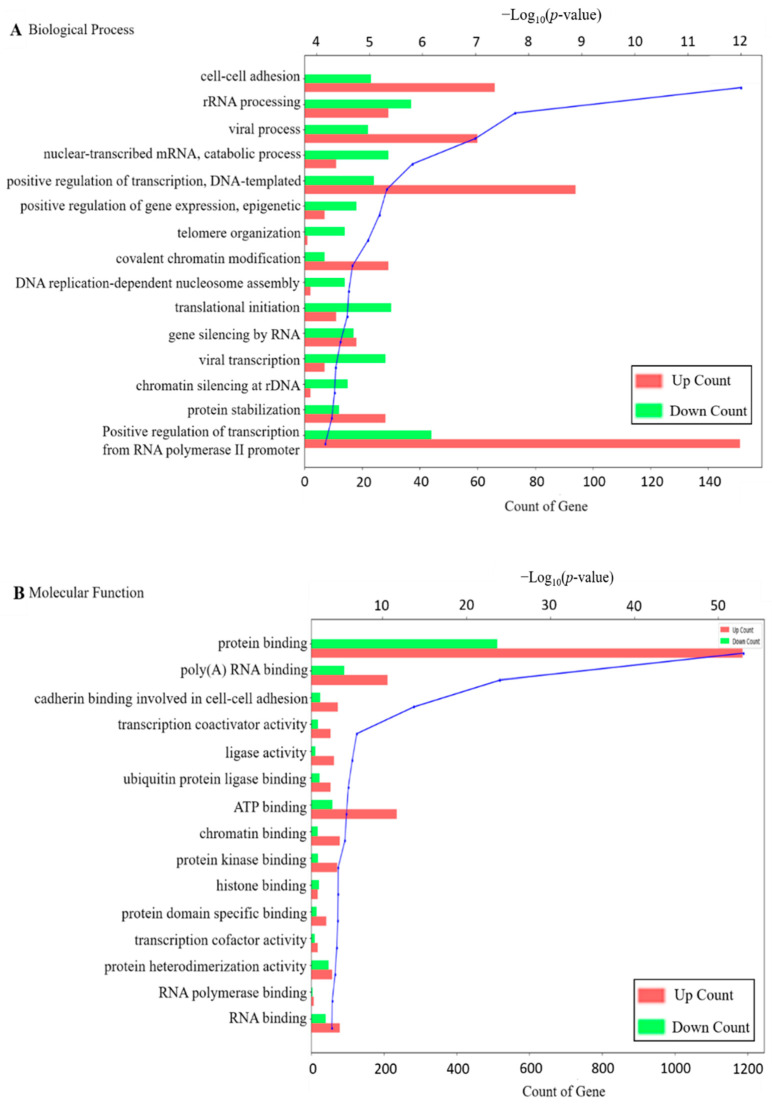
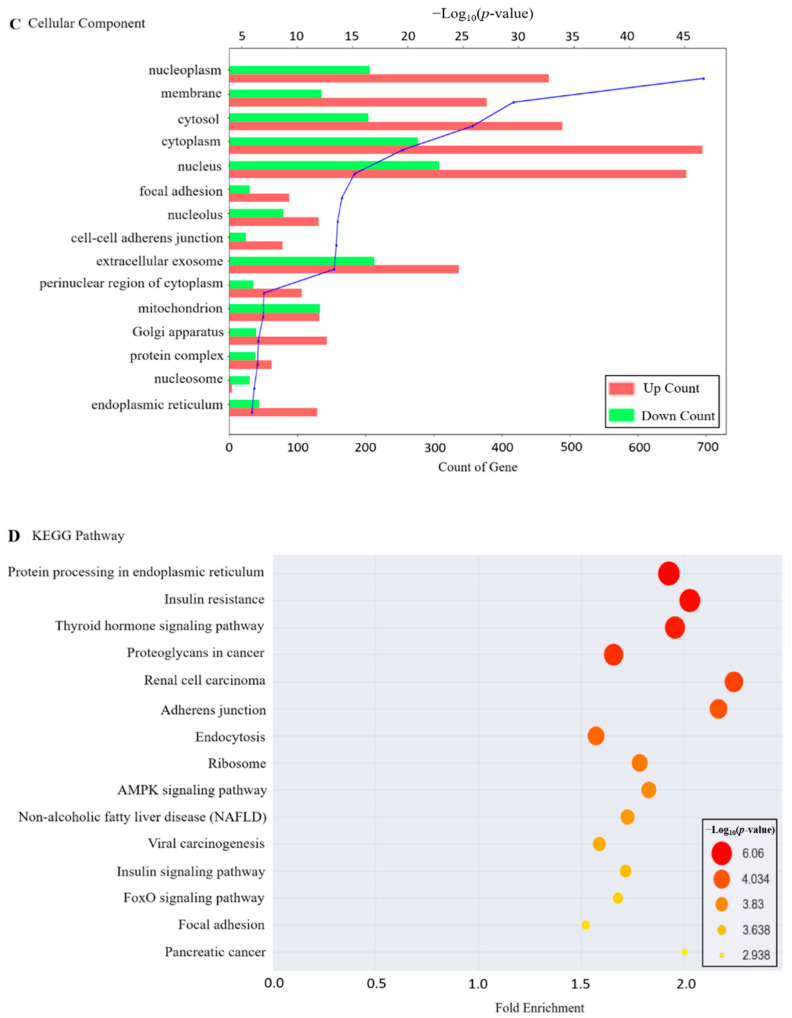
Figure 3.
Functional annotation of DEGs. Functional categories of DEGs, broadly separated into (A) biological process, (B) molecular function and (C) cellular component, based on Gene ontology (GO). The blue line of the graphs means −log10(p-value); (D) Top fifteen enriched pathways in HK-2 cells exposed to OTA, analyzed by the KEGG pathway analysis (p < 0.05), the size and color of the circle mean −log10(p-value). The position of the x-axis represents the degree of fold enrichment.


