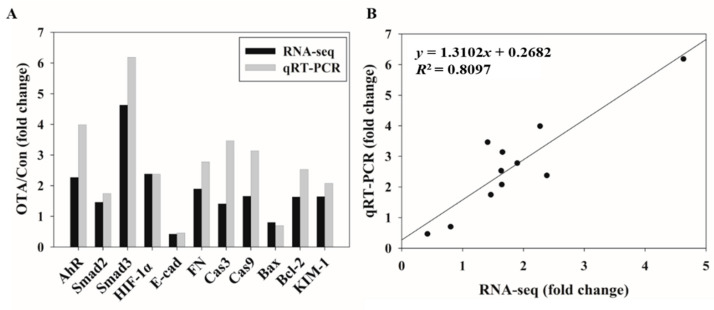
Figure 4.
Comparison and validation of OTA-induced gene expression changes determined by RNA-seq and qRT-PCR. (A) Fold change of expression value of OTA compared to control measured by RNA-seq and qRT-PCR in eleven selected genes. (B) Correlation plot between RNA-seq fold change (FC) compared to qRT-PCR FC. AhR, Aryl Hydrocarbon Receptor; Smad; HIF-1α, Hypoxia-inducible factor 1-alpha; E-cad, epithelial-cadherin; FN, Fibronectin; Cas, Caspase; Bax, Bcl-2-associated X protein; Bcl-2, B-cell lymphoma 2; KIM-1, Kidney injury molecule-1.

