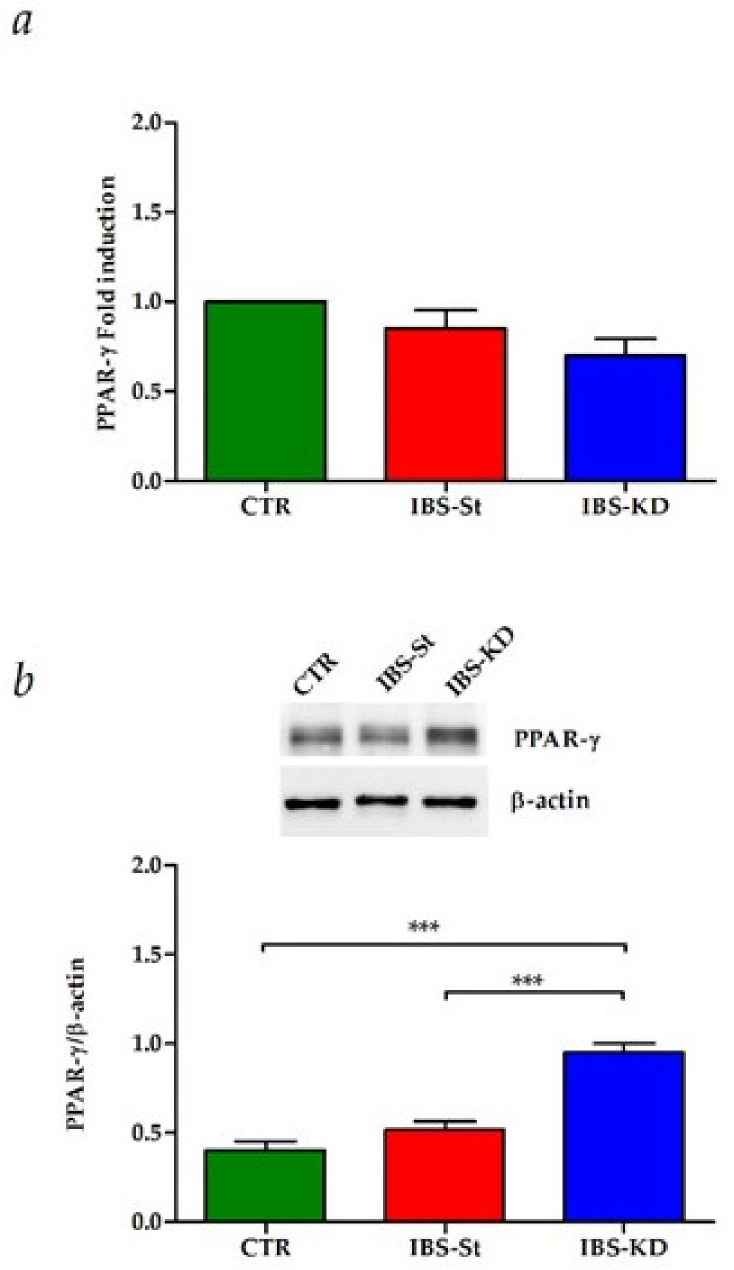
Figure 3.
(a) Peroxisome proliferator-activated receptor-gamma (PPAR-γ) gene expression levels in the control group (CTR), IBS rats fed a standard diet (IBS-St), and IBS rats treated with low-carbohydrate, high-fat ketogenic diet (IBS-KD). (b) PPAR-γ protein expression levels, and representative blots in the control group (CTR), IBS rats fed a standard diet (IBS-St), and IBS rats treated with low-carbohydrate, high-fat ketogenic diet (IBS-KD). All data represent the results of three different experiments (mean ± SD); p-value was determined by ANOVA with Tukey’s multiple comparison test; *** p < 0.001.

