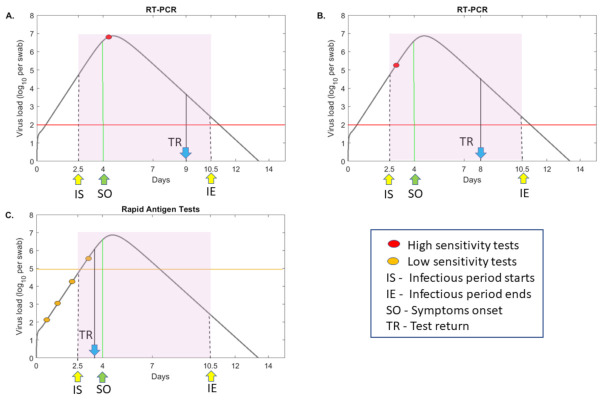
Figure 1.
RT-PCR versus rapid testing practices. virus load per swab over time as given by model (1) (grey curves) for values in [26]. Patients are assumed to be infectious from days (IS) till days (IE) (shaded region) and symptomatic beginning on day (SO). Panels (A) and (B) depict testing with a high-sensitivity RT-PCR test with detection threshold per swab (red line) and test return delay of five days. In panel A, the test occurs immediately following symptoms onset, and in panel B, the test occurs before symptoms onset (red circles). Panel C depicts frequent testing (yellow circles) with a low-sensitivity test with detection threshold per swab (yellow line) and test return delay of one half day. TR shows the time of positive test result.

