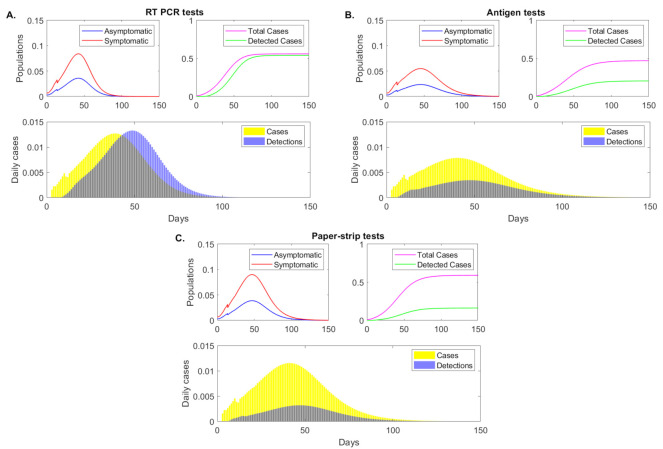
Figure 2.
Epidemic dynamics over time. Sample epidemic dynamics results from varying testing regimes, as given by model Equation (5) for fixed testing capacity. Panel (A): RT-PCR, detection threshold , test return delay 5 days; Panel (B): antigen test, detection threshold , test return delay 0.5 days; Panel (C): paper-strip test, detection threshold , test return delay 0.1 days. Upper left figures: asymptomatic (blue), symptomatic (red) case (as proportion of the total population) over time. Upper right figures: cumulative positive cases (magenta) and cumulative detected cases (green) (as proportion of the total population) over time. Lower figures: daily new cases (yellow bars) and daily new case detections (blue bars).

