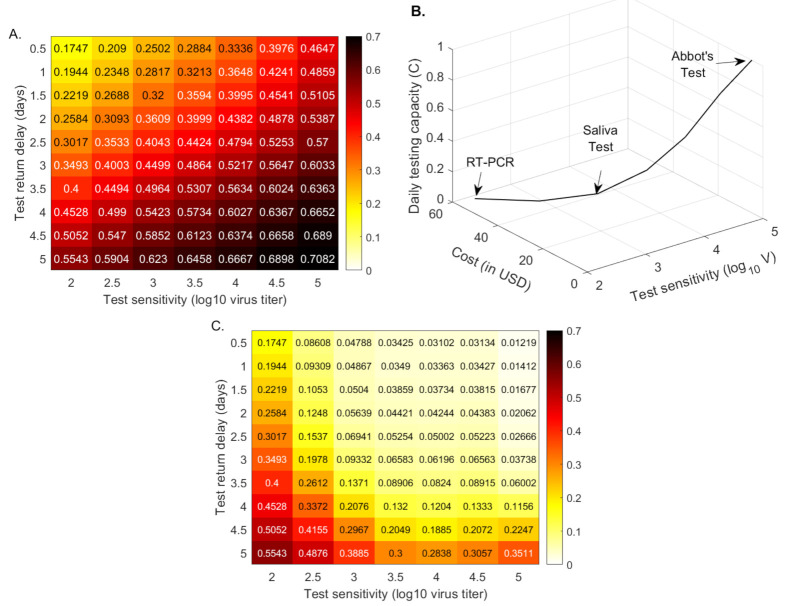
Figure 3.
Cumulative cases (as proportion of the total population) at half a year. Heatmaps for the cumulative cases (as proportion of the total population) at half a year after the outbreak (% of the total population) as given by model Equation (5) versus test sensitivity and test return delay. Panel (A): fixed testing capacity per day, . Panel (B): relationship between capacity and cost. Panel (C): fixed testing budget per day. Parameters and initial conditions are given in Table 1 and Table 2.

