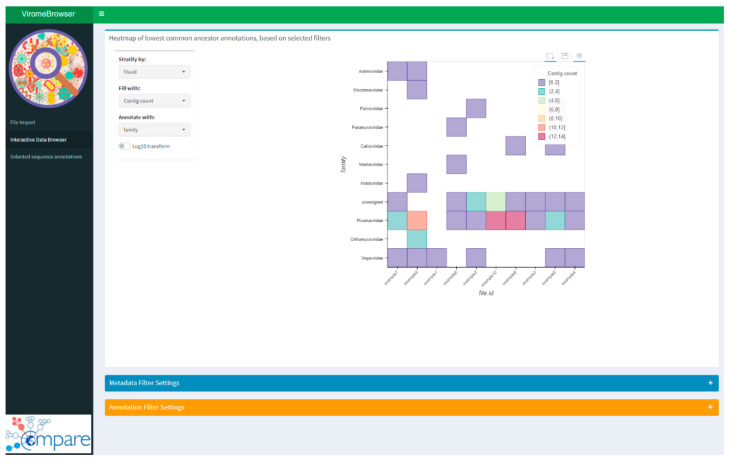
Figure 2.
Screenshot of the interactive data browsing heatmap. Stratification variable and filter criteria can be selected in the browser settings window. Annotation quality filter settings are available as a drop-down menu in the bottom of the page. Hovering over the heatmap shows the contig annotations and the number of contigs or read counts. Selecting tiles of the heatmap results in selection of only those contigs for further analysis and downloading.

